Income Driven Investing
A Simple, Logical and Disciplined Approach to Managing Interest Risk
In March 2020, following the onset of the Covid-19 pandemic, the 10-year Treasury yield fell to 0.5%. Trailing returns for fixed income funds were strong thanks to the collapse in rates and “lower for longer” was a common outlook as trillions of dollars in sovereign debt around the world was trading at negative yields. Investors viewed “any yield” as better than no yield, and fixed income funds saw massive inflows – nearly $450B in 2020 followed by a record inflow of $593B in 2021. Rather than stay short on the curve to preserve capital, however, more than half of all flows went into full market funds with a duration range of approximately six years, which then suffered large losses when rates rose sharply in 2022.
In contrast, consider September 1981, when nearly the opposite occurred. After years of exceptionally volatile rates and rising inflation, the 10-year Treasury yield rose to a record high 15.8%. Bondholders had grown weary of persistently falling prices and risk tolerance was low. Many were avoiding bonds altogether in favor of higher-yielding money market funds and bank CDs, seeking to preserve capital. Yet, those who bravely invested in bonds at that time – ideally, longer-term maturities – were well-rewarded for doing so. Not only was the annual income abundant but, when yields fell, total returns were historically high.
Why are we prone to irrational behavior as investors? Why do we too often sell when we should buy and buy when we should sell? Market history is replete with examples of this behavioral dynamic.
Behavioral Patterns Detract from Returns
Behavioral studies have shown that losing money feels twice as bad as gaining the same amount. We know that loss aversion is real and played a role in the early-1980s example above. In the 2020-2021 example, recency bias, where we overemphasize recent returns when estimating future results likely added to fund flows. To estimate how much these behavioral patterns impact fixed income returns, we analyzed the one-year returns of the Bloomberg Barclays Aggregate Index (the Agg) following months of inflows and outflows of taxable mutual funds (using ICI fund flows from 2013 through 2023). Unfortunately, the results confirmed our suspicions. The average one-year return following outflow months was twice as positive, +2.34%, as they were following inflow months, +1.17%. Had investors done the opposite of the crowd they would have doubled their 12-month returns. The performance gap was even larger when just the top 25 months of inflows and outflows were reviewed. One-year returns following the heaviest months of outflows was +2.43% and a loss of -1.19% following heavy inflow months, a difference of 362 basis points! A similar pattern was found when reviewing municipal fund flows as well.
Why Individual Investors Should Consider IDI
One way for investors to improve on their buying and selling decisions, implement a more disciplined approach and enhance long-term returns, is to follow an Income Driven Investing (IDI) strategy. IDI uses the level of market income (yield) available to decide when to either dial up or down the interest rate risk of a core fixed income portfolio. If followed, IDI offers a simple, logical approach to sell into strength and buy into weakness. IDI seeks to align the duration of a fixed income portfolio, which is a measure of the expected price volatility for a 100-basis point move in rates, with the level of yield/income available in the market. IDI seeks to add more duration risk when yields are high and to reduce duration when yields are low. This approach would have led to a cautious duration posture in 2020 and 2021 when yields were near historic lows and would have guided investors to extend duration in the early-1980s when rates were at record highs – and, importantly, neither move is dependent upon forecasting inflation, economic growth, or interest rates.
Trading Short-term Price Risk for Long-term Income Reward
The total return of any core fixed income portfolio is comprised of just two factors: income and price change. And while price changes often drive returns over short time periods, income clearly plays the more dominant role over extended periods. In 2022, the worst year for bond market returns ever recorded in the U.S., investors simply had too little income to offset the rise in rates following the inflation spike and aggressive Fed response. Only the shortest duration strategies were able to preserve capital, while full-market strategies such as the Agg Index, with a starting duration of 6.8-years, had a total return of -13.01%. Price declines overwhelmed the minimal income available in that short-term period.
However, the dominance of income in bond returns becomes evident over longer timeframes. From December 1982 through December 2023, a period that covered the entirety of the 40-year secular bull market in bonds, when yields fell and prices rose, income still provided over 90% of the annualized total return of the Agg Index, according to Bloomberg. Income clearly dominated over price, even in the bull market.
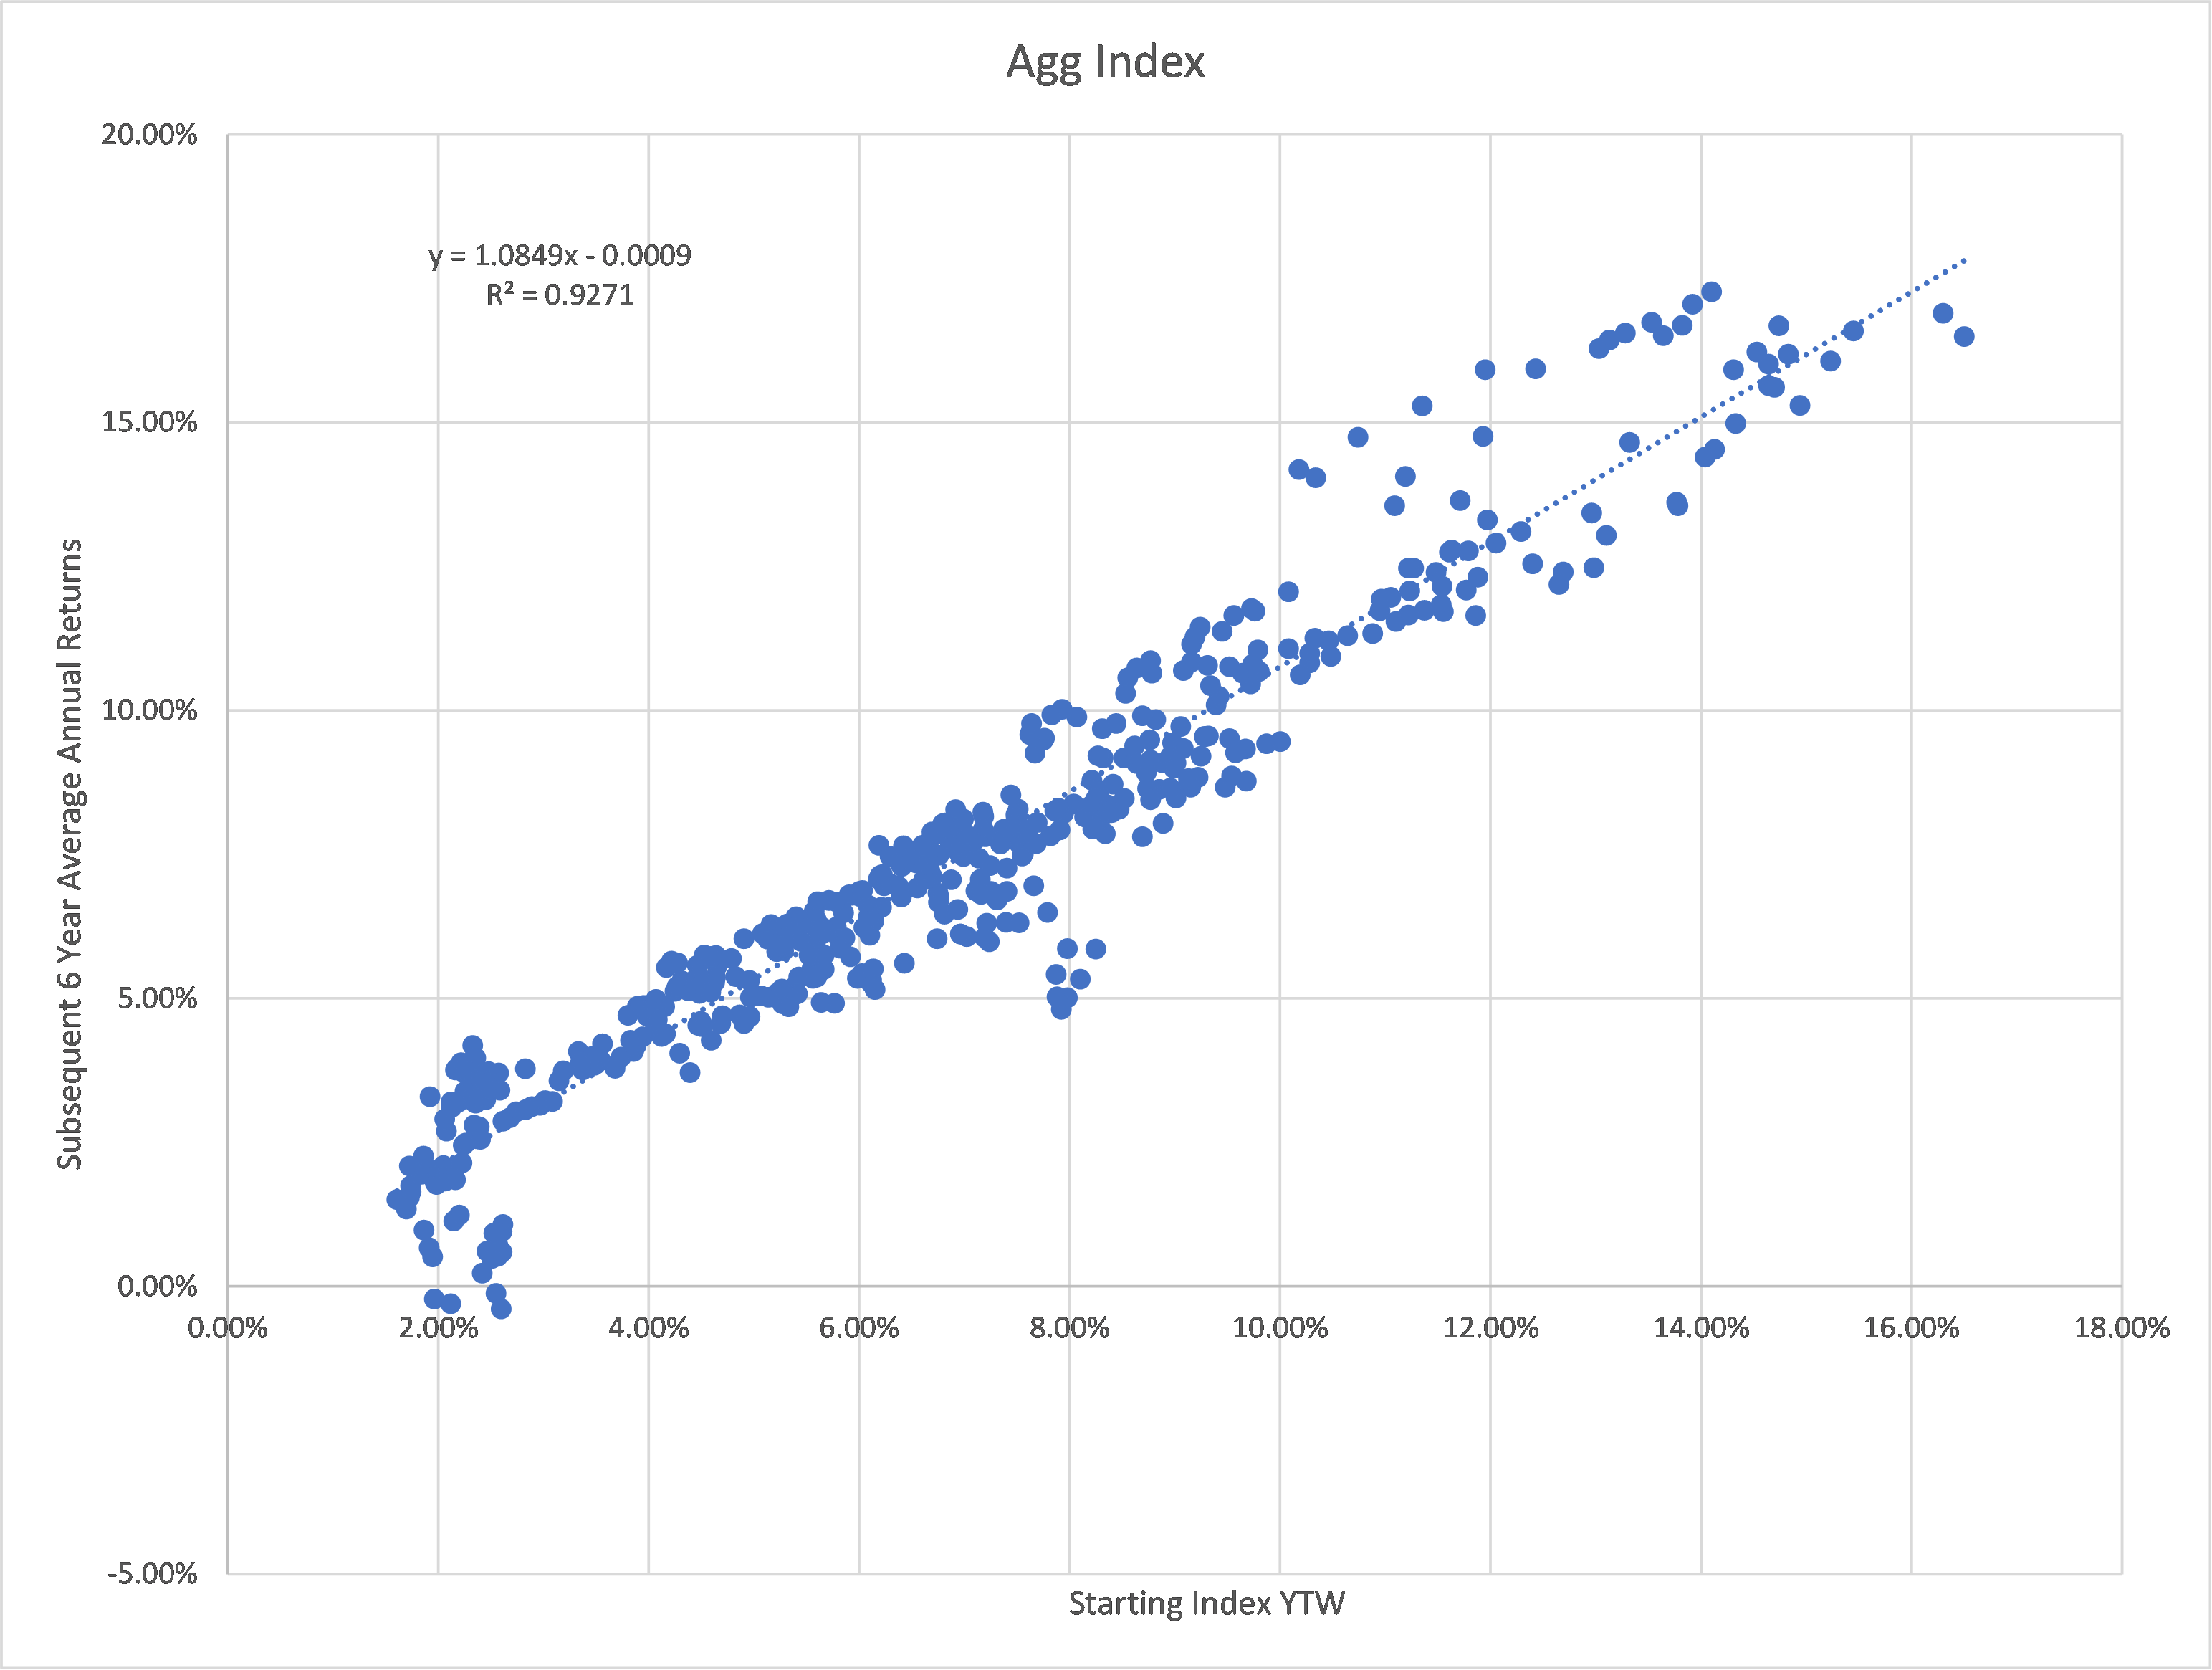
The importance of income is also evident over intermediate timeframes. Each dot in the graph below represents the total return of the Agg Index over six-year timeframes relative to the Index yield at the start of the period. When starting interest rates and income levels were high, total returns were similarly high. Conversely, at low initial yield levels, the Agg produced low or negative total returns (Note: returns from 2018 – 2023 are not yet reflected). Therefore, seeking a balance between income and price volatility is the key to establishing a target duration level through the IDI approach.
Bloomberg Aggregate Index Returns vs. Initial Yield Over Six-year Holding Periods
(1976 – 2017)
Source: Bloomberg
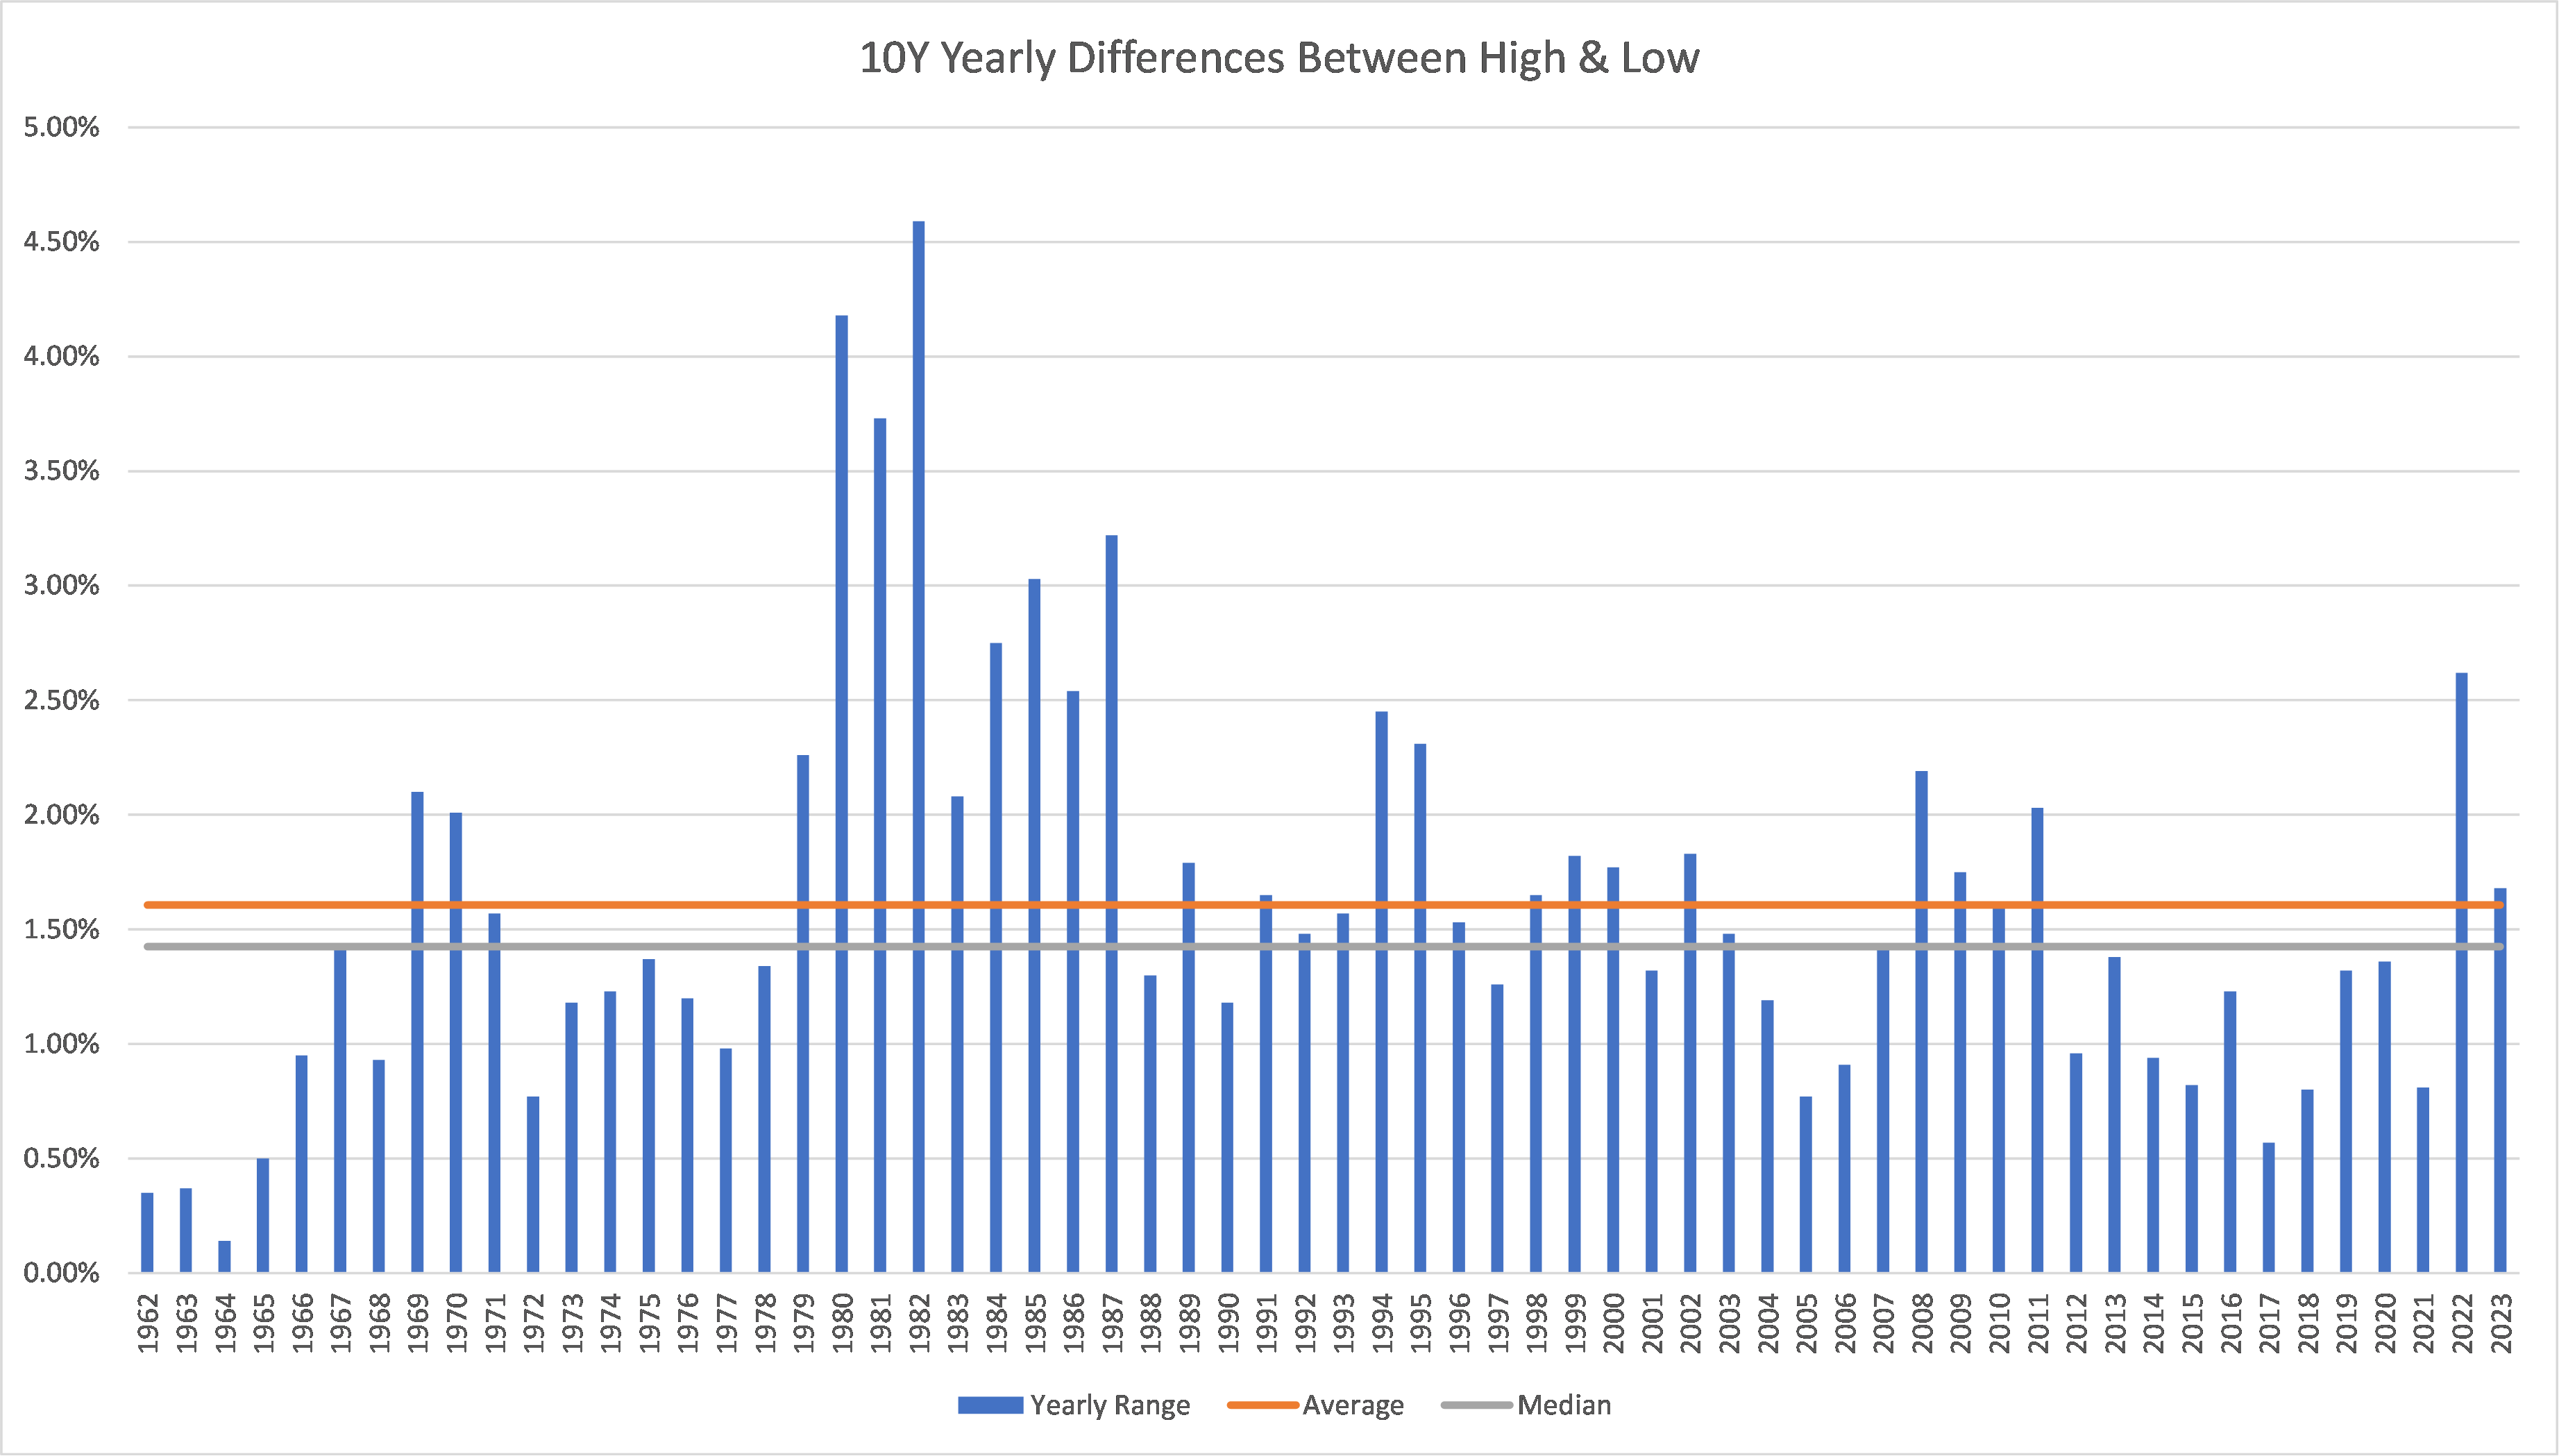
To help estimate the amount of price volatility that may occur in any calendar year we reviewed the yearly change in the 10-year Treasury yield (peak to trough) over more than a 60-year period, from 1962-2023. We found the average annual yield volatility was 161 basis points and the median intra-year yield change was 143 basis points. In 75% of the periods rates rose or fell intra-year by at least 100-basis points; 25% of the time the rate change was at least 200 basis points. Investors need to understand that annual rate volatility of 100 – 150 basis points is “normal” and should be expected when considering the appropriate duration target. In 2023, the range of the yield on the 10yr Treasury yield was 168 basis points (3.31% to 4.99%).
10Yr Treasury Rate Volatility
(Annual Peak – Trough basis points change)
1962 – 2023
Source: Bloomberg
Given this level of volatility, one immediate takeaway is just how futile it is to attempt to predict the direction of rates with any consistency and the IDI approach makes no attempt to do so. Equally important is an understanding that a fixed income allocation is, at least for most individual investors, ultimately a risk-mitigation decision. While seeking income, investors also look to bonds to lower the overall risk of their total portfolio (which is the theoretical foundation behind the traditional 60/40 allocation). If duration risk is too high, then the price change under normal levels of rate volatility will overwhelm income (as in 2022); if duration is too low (which it was for many in 1981), then income and return opportunities are missed.
The goal of IDI is to enhance total returns over time but to do so in a smoother, more risk-controlled manner. The optimal risk/reward posture is found through a closer alignment of yield and duration at each point in a rate cycle, which the IDI approach offers. By reducing duration when yields are low and price risk is high, IDI guides investors to focus primarily on capital preservation. Conversely, IDI guides investors to also play offense and lengthen duration as income levels and return opportunities rise.
Implementing IDI – Establishing Income Levels and Duration Targets
An appropriate reference for the level of income in the taxable bond market is the yield-to-worst (YTW) of the Agg Index. The Agg is a broad market index with exposure to all the major taxable sectors, including Treasuries, corporates, and mortgage-backed securities. As of December 31, the YTW of the Bloomberg Aggregate Index was 4.5%. If we accept that a 4.5% income level is achievable and our goal is to align duration with income, then the target duration under the IDI approach would also be 4.5-years. This means that for a 100-basis point move in rates, the expected range of estimated returns over a 12-month period would be 0% to +9.0% (not consider credit spread changes and curve roll-down benefits). For a 150-basis point change in rates, the estimated return range widens to -2.25% to +11.25%. More risk averse investors seeking to avoid the potential of a negative return at 150-basis points of rate volatility, then the duration target should be reduced. However, this will also reduce the upside of the return range should rates fall.
To implement the IDI duration targets in the taxable market, an investor could use a combination of funds that are managed against broad market indices, many of which offer yields approximating their respective benchmarks. For example, at year end a 4.5-year duration was achievable using a 70/30 blend of the Bloomberg Intermediate Govt/Credit Index (3.7-year duration) and the Bloomberg Aggregate Index (6.2-year duration). This combination of indices provided a blended yield of 4.5%, aligning the income and duration as IDI suggests.
Municipal Income Driven Investing (MIDI) – Adjusting for Tax-Free Yields
The IDI approach can also be used to help guide investors with their municipal allocation but with a couple of modest adjustments. The preferential tax treatment of tax-free bonds and the lower historic volatility of municipals relative to Treasuries needs to be considered. To identify an appropriate tax-exempt yield target, a broad market reference for income is the YTW of the Bloomberg Municipal Index. Since January 1980, the median yield ratio between the tax-exempt Municipal Index and the taxable Aggregate Index is 82%, so a 20% effective federal tax rate is an appropriate adjustment to place tax-free yields on a tax-equivalent basis. This implies a cross-market volatility adjustment of 20% is also justified.
At the end of December, the YTW of the Bloomberg Municipal Index was 3.2%, which results in a tax-equivalent yield at the 20% tax rate of 4.0% (3.2%/ (1 – 0.20%)). A duration of 4.0-years then becomes our MIDI target duration. Lowering the assumed rate volatility of municipals by 20% also reduces the intra-year volatility range to 80-120 basis points. With these adjustments, the estimated return range for an 80-basis point move in AAA tax-exempt yields would be 0% to 6.4%. For a 120-basis point move the range of returns widens to an estimated -1.6% to +8.0%. Importantly, the estimated returns do not reflect the tax-free income benefit to the investor.
To achieve the MIDI duration targets, an investor could use a combination of tax-free funds that are managed against broad municipal market indices, many with yields approximating their respective benchmarks. For example, a 4.0-year duration was available at year-end using an 80/20 blend of the Bloomberg Municipal 1 – 15 Year Index (4.5-year duration) and the Bloomberg Short-term 1 – 5 Year Index (2.3-year duration), respectively. This allocation provided a blended tax-free yield of 3.6%, only slightly below our aligned target.
Rebalancing
Each investor can decide how “active” to be using the IDI approach. Some may want to rebalance after a specific rate move (perhaps 100 basis points) while others may simply want to review the alignment annually. Whatever the cadence, unless new money is added to the portfolio to achieve the desired duration, rebalancing will lead to harvesting both losses and gains as rates rise and fall. Fortunately, the IRS allows realized losses to be used to offset gains, either in the year captured or carried forward indefinitely. The more difficult decision may be deciding when gains should be taken if rates fall. While investors will be tempted to maintain their higher income and duration levels when that occurs, it is important to remember that current income levels should drive duration. Complacency could prove costly, particularly at extreme yield levels.
Most individual investors hold bonds in the hope they will offset risk in other investment asset classes. Income obviously plays a significant role in this dynamic. To achieve that goal, investors should play defense, providing themselves a margin of safety to offset normal levels of rate volatility by reducing duration as rates fall. But since income dominates price over extended periods, an offensive mindset is also required to win. As rates rise, investors should be opportunistic and extend duration accordingly. Moving away from a static, set-it-and-forget-it, duration approach may be a new concept for many, but aligning income and duration over time can be rewarding and the IDI (and MIDI) approach is a simple, logical and disciplined way to do that.
Disclosures
Investors should consider the investment objectives, risks, charges and expenses of the fund carefully before investing. This and other information about the fund can be found in the prospectus or summary prospectus. A prospectus or summary prospectus may be obtained from your financial advisor or the fund website and should be read carefully before investing.
This is not a complete analysis of every material fact regarding any company, industry or security. The information has been obtained from sources we consider to be reliable, but we cannot guarantee the accuracy. Fixed income is generally considered to be a more conservative investment than stocks, but bonds and other fixed income investments still carry a variety of risks such as interest rate risk, credit risk, inflation risk and liquidity risk. In a rising interest rate environment, the value of fixed income securities generally declines and conversely, in a falling interest rate environment, the value of fixed income securities generally increases. High-yield securities may be subject to heightened market, interest rate or credit risk and should not be purchased solely because of the stated yield. Municipal securities may or may not be appropriate for all investors, especially for those in lower tax brackets.
All investments carry risk, including loss of principal. In a rising interest rate environment, the value of fixed-income securities generally decline and conversely, in a falling interest rate environment, the value of fixed income securities generally increase. Past performance is not indicative of future results and diversification does not ensure a profit or protect against loss. All investments carry some level of risk, including loss of principal. An investment cannot be made directly in an index. The yield-to-worst (YTW) is the lowest estimated yield that can be received on a callable bond at current market price absent a default. The YTW is calculated by using the lower of yield-to-maturity or yield-to-call (an earlier date that the issuer could redeem the bond). The weighted average YTW of a Fund does not include fund fees and expenses
©2024 Robert W. Baird & Co. Incorporated. Member IPC.
Robert W. Baird & Co. Incorporated. 777 East Wisconsin Avenue, Milwaukee, Wisconsin 53202.
First Use:1/2024.