Consider Actively Managed International Equity Funds for Diversification

Worldwide investing offers an expanded opportunity set. 

Approximately 96% of the world’s population, 84% of the world’s economic activity (75% based on nominal GDP) and 65% of public companies with market capitalizations greater than $5 billion are outside the U.S. – yet most U.S. investors are under-invested in international companies.

Additionally, the U.S. does not have a monopoly on competitively advantaged companies with long growth runways ahead of them.  In fact, on average over the last 12 years, 76% of the 50 top performing stocks in the MSCI ACWI World Index were non-US stocks.

US Equity Valuations are Near Record High Values

US equity valuations (as measured by the forward price-to-earnings ratio of the S&P 500) are at an extreme variance relative to non-US (International) valuations (as measured by the forward price-to-earnings ratio of the MSCI ACWI ex-US) that have not been seen since 2005. In the chart below, the blue line illustrates the ACWI ex-US Index forward price-to-earnings discount relative to the S&P 500 Index forward price-to-earnings. The last time we witnessed similar extremes was at the outset of a period when International equities outperformed1 US equities from 2002 to 2007.

International Equities May be a Strong Diversification Tool

Studies (Vanguard, 2019) have shown that international allocations up to 40% have historically resulted in a reduction of over-all volatility by as much as 10% versus an all US equity portfolio. While correlations have varied over-time, there’s a case to be made that as globalization declines so too may US/International correlations.

International Equities May be Poised for Outperformance

Periods of US/International performance dominance tend to be long.  The last 10 years of US performance dominance followed a similarly long period of international dominance in the prior ten years.  Aside from the dramatic underperformance of international in the late 1990s – Asian Financial Crisis in 1997 followed by the Russian default in 1998 while the US was in the midst of "dot.com irrational exuberance" – international’s relative underperformance is again approaching historical extremes in both duration and magnitude. Additionally, though the US dollar hit its highest price in 20 years in 2022, it has recently retreated as US inflation slows and the pace of US rate hikes is set to decelerate, among other reasons.  Should the US dollar continue to weaken versus local currencies of international companies, our expectation is that non-US stocks should outperform. 

International Indices Underrepresent the Growth Opportunities that Exist Outside of the US Today

International indices are significantly overweight “value” oriented economic sectors such as financials, industrials, materials and energy while under representing the “growth” oriented sectors information technology, health care, communications services and consumer discretionary.

Importantly, not only are these average international growth sector stocks cheaper than their US counterparts they are actually growing faster.

Chautauqua Capital: “Stock Selection Drives Returns”

Based on current index sector data, international indices are not representative of the growth opportunities that exist outside of the US.  We believe that in-depth fundamental analysis on a company by company basis is a much better way to uncover great wealth generating companies that are domiciled outside of the US.

Chautauqua’s investment philosophy and process is deployed to construct funds comprised of such companies that benefit from long-term secular trends and possess the business model advantage. We take great care as we apply quality criteria, evaluate macro economic forces and apply proprietary forward looking valuation criteria. The result of our investment approach has been relative outperformance since inception versus stated benchmarks for our funds. 

Chautauqua International Growth Fund

Chautauqua Global Growth Fund

Important Disclosures

Investors should consider the investment objectives, risks, charges and expenses of each fund carefully before investing. This and other information is found in the prospectus and summary prospectus. For a prospectus or summary prospectus, contact Baird directly at 866-442-2473. Please read the prospectus or summary prospectus carefully before investing.

Performance data quoted represents past performance. Past performance does not guarantee future results. Investment return and principal value of an investment in the fund will fluctuate so that an investor's shares, when redeemed, may be worth more or less than their original cost. The funds' current performance may be lower or higher than the performance data quoted.

Chautauqua Capital Management obtained some information used in this presentation from third party sources it believes to be reliable, but this information is not necessarily comprehensive and Chautauqua Capital Management does not guarantee that it is accurate. Neither Chautauqua Capital Management, its affiliates, directors, officers, employees or agents accepts any liability for any loss or damage arising out of your use of all or any part of this presentation. There is no guarantee the Fund will meet its investment objectives. All investments involve risk, including the possible loss of principal. Asset allocation and diversification do not ensure a profit or protect against a loss. There is no assurance that any investment strategy will be successful or that any securities transaction, holdings, sectors or allocations discussed will be profitable.

Graphs or other illustrations are provided for illustrative purposes only and not intended as a recommendation to buy or sell securities displaying similar characteristics.

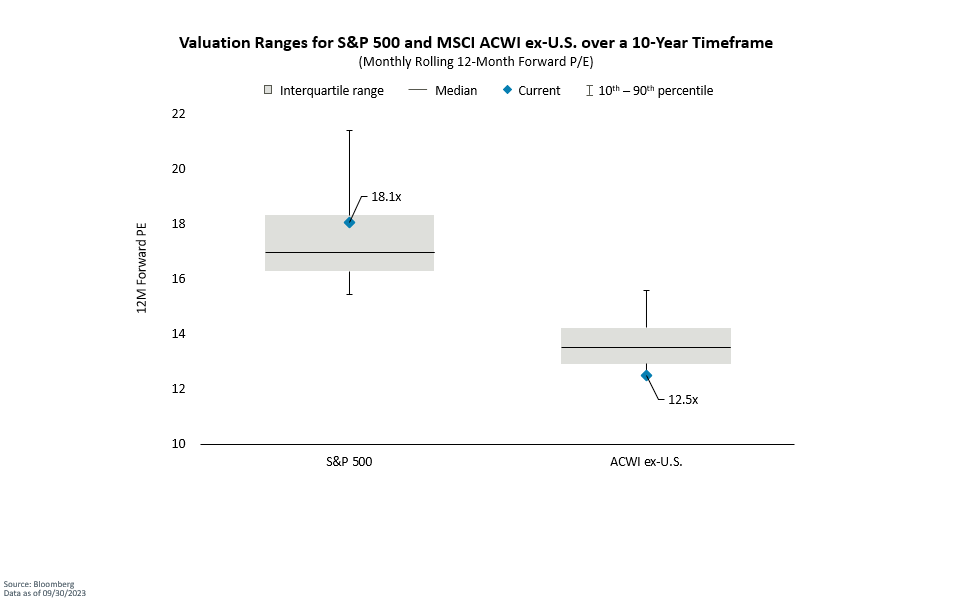
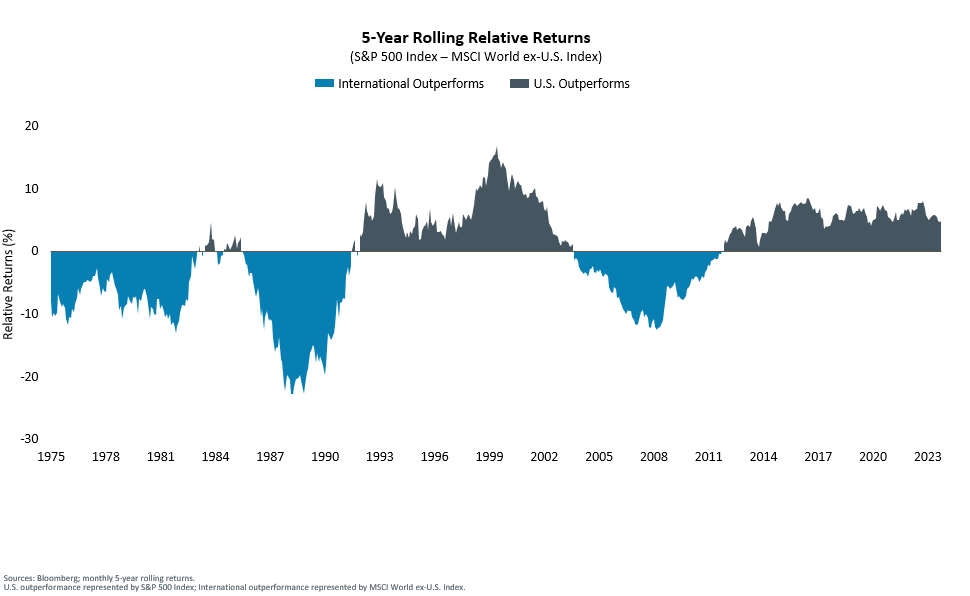
The Standard & Poor's 500 Index (S&P 500) is an index of 500 stocks chosen for market size, liquidity and industry grouping, among other factors. The S&P 500 is designed to be a leading indicator of U.S. equities.

The MSCI World ex-U.S. Index® is a free float-adjusted market capitalization weighted index that captures large and mid cap representation across 22 of 23 Developed Markets (DM) countries excluding the United States.

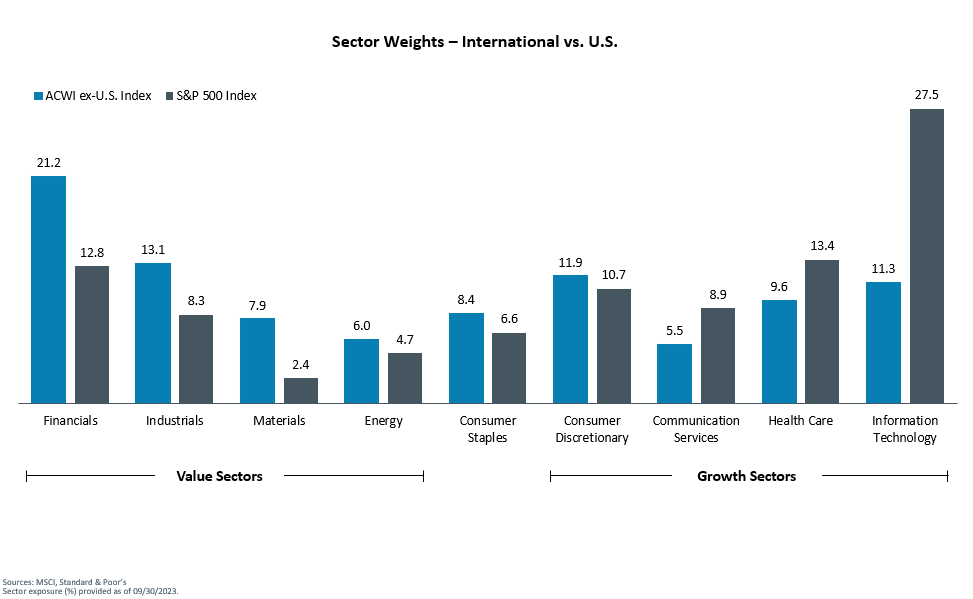
The MSCI ACWI ex-U.S. Index® is a free float-adjusted market capitalization weighted index that is designed to measure the equity market performance of developed and emerging markets excluding the United States. The MSCI information may only be used for your internal use, may not be reproduced or disseminated in any form and may not be used as a basis for or a component of any financial instruments or products or indices. None of the MSCI information is intended to constitute investment advice or a recommendation to make (or refrain from making) any kind of investment decision and may not be relied on as such. Historical data and analysis should not be taken as an indication or guarantee of any future performance analysis, forecast or prediction. The MSCI information is provided on an “as is” basis and the user of this information assumes the entire risk of any use made of this information. MSCI, each of its affiliates and each other person involved in or related to compiling, computing or creating any MSCI information (collectively, the “MSCI Parties”) expressly disclaims all warranties (including, without limitation, any warranties or originality, accuracy, completeness, timeliness, non-infringement, merchantability and fitness for a particular purpose) with respect to this information. Without limiting any of the foregoing, in no event shall any MSCI Party have any liability for any direct, indirect, special, incidental, punitive, consequential (including, without limitation, lost profits) or any other damages. (www.msci.com)

The 2019 Vanguard report referred to was titled "Global equity investing: The benefits of diversification and sizing your allocation."