
Going Abroad for a Free Lunch
Allocating to International Equities
Diversification of portfolios using international equities can reduce volatility and enhance risk-adjusted returns, especially given recent geopolitical shifts that decrease correlations between U.S. and international markets. Despite some investor skepticism, and as we discuss below, the benefits of international diversification can be significant and should be considered in investment strategies.
Nobel prize winning economist, Harry Markowitz famously said that “diversification is the only free lunch in finance.” His widely adopted framework and model have shown that by diversifying the risk in a portfolio using varying asset classes, investors can benefit from lower volatility while sacrificing little in expected returns over longer periods of time. The less correlated the asset classes in your portfolio, the greater the diversification benefit in terms of volatility reduction.
U.S. and International Portfolio Blends
January 1970 – April 2025
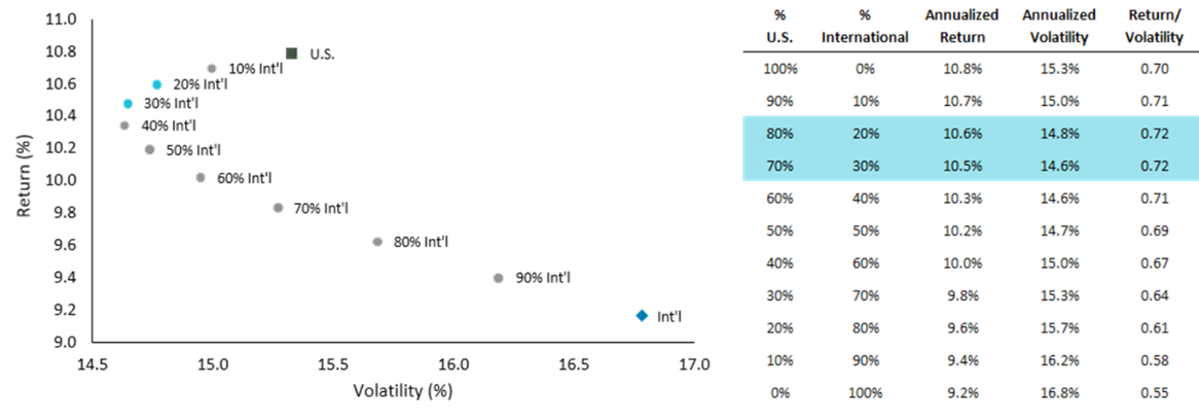
Source: eVestment. U.S. represented by S&P 500 Index, International represented by MSCI World ex-U.S. Index. Volatility measurement used is standard deviation.
From the 1970s to the mid-1990s, 12-month correlations between U.S. and international equities averaged 0.47. U.S./international correlations have increased significantly since then, a period that saw the signature events of the globalization era – the establishment of the World Trade Organization (WTO), North American Free Trade Agreement, the launch of the Euro, and China’s admittance to the WTO in 2001. Not only was this period characterized by higher trade flows, but it also saw higher capital flows across borders. These factors led to increased correlation in asset prices across countries thereby reducing the value of international diversification. Correlations during the peak globalization era averaged 0.83.
However, since 2016, as evidenced by Brexit and the first U.S./China trade war, we have seen a rise in economic nationalism and the erection of barriers to cross-border movement of goods, capital, and labor. The fragmentation of global supply chains and re-shuffling of trading relationships that started in 2016 is accelerating with the chaotic rollout of the second Trump Administration’s trade policies, increasing the benefits of international diversification as correlations decline.
The biggest pushback we often hear when extolling the diversification benefits of international equities is that “clients can’t eat” risk-adjusted returns. Many investors will shrug off risk as long as their returns are strong. Or said differently, it is the destination that matters, not how circuitous the route is that gets you there. In theory, they have a point. But in practice, the most thoughtful and effective investment plan is rendered useless if a client is unable to stick with the program because of excessive volatility. Even at peak correlations, we believe an allocation to international equities is still an effective diversifier and volatility dampener and thus deserves a place in client portfolios.
Rolling 12-Month Correlations between International and U.S.
January 1970 – April 2025
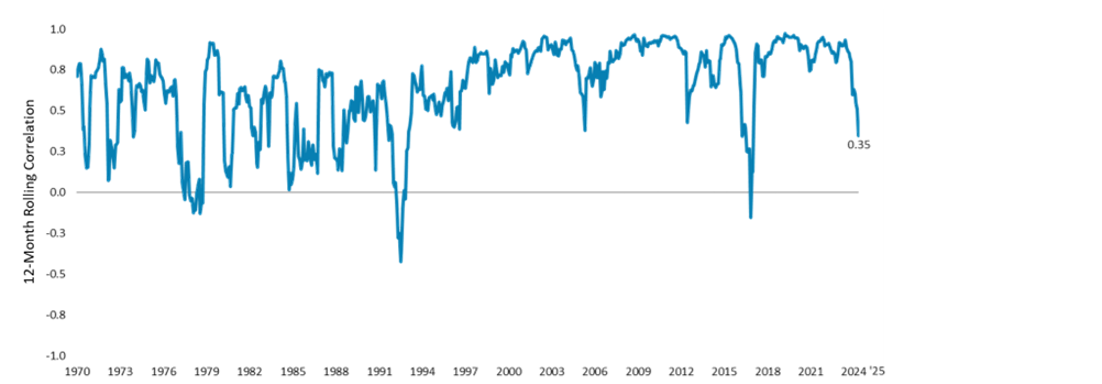
International and U.S. Correlation Averages
- Pre-WTO (1970 – 1995): 47
- Peak Globalization (2006 – 2016): 83
- Since November 2024: 54
Source: Bloomberg. U.S. represented by S&P 500 Index, International represented by MSCI World ex-U.S. Index.
Disclosures
Information in this document regarding market or economic trends, or the factors influencing historical or future performance, reflects the opinions of management as of the date of this document. These statements should not be relied upon for any other purpose. References to individual securities should not be construed as a recommendation to buy, hold, or sell a security, and it should not be assumed that holdings have been or will be profitable.
Foreign investments involve risks such as currency rate fluctuations and the potential for political and economic instability, and different and sometimes less strict financial reporting standards and regulations.
Past performance is not indicative of future performance. All investments are subject to risk, including loss of principal.
Portfolio standard deviation is a statistical measure that indicates the volatility or risk of a portfolio of investments. It represents the average amount by which the portfolio's returns deviate from its mean return. A higher standard deviation means greater volatility, and a lower standard deviation indicates lower volatility. Correlation measures the degree to which two variables are linearly related, calculated on a scale from -1.0 to 1.0.
The S&P 500® Index is an unmanaged index consisting of 500 publicly traded large-cap U.S. companies. The MSCI World ex-U.S. Index® is a free float-adjusted, market capitalization-weighted index designed to represent performance of large- and mid-cap stocks across developed markets excluding the United States. Indices are unmanaged and direct investment is not possible. “ND” represents net of dividends returns for the benchmark.
The MSCI information may only be used for your internal use, may not be reproduced or disseminated in any form and may not be used as a basis for or a component of any financial instruments or products or indices. None of the MSCI information is intended to constitute investment advice or a recommendation to make (or refrain from making) any kind of investment decision and may not be relied on as such. Historical data and analysis should not be taken as an indication or guarantee of any future performance analysis, forecast or prediction. The MSCI information is provided on an “as is” basis and the user of this information assumes the entire risk of any use made of this information. MSCI, each of its affiliates and each other person involved in or related to compiling, computing or creating any MSCI information (collectively, the “MSCI Parties”) expressly disclaims all warranties (including, without limitation, any warranties or originality, accuracy, completeness, timeliness, non-infringement, merchantability and fitness for a particular purpose) with respect to this information. Without limiting any of the foregoing, in no event shall any MSCI Party have any liability for any direct, indirect, special, incidental, punitive, consequential (including, without limitation, lost profits) or any other damages. (www.msci.com)
©2025 Robert W. Baird & Co. Incorporated.