
Global Valuations: A Turning Point for Market Leadership?
History shows that the main drivers of long-term stock performance are company earnings growth and dividends, and while the price investors are willing to pay for that performance can have wide swings, valuation multiples typically revert to their long-term averages. The S&P 500’s “lost decade” from January 2000 to December 2009 can be used to illustrate this point. At the start of the period, U.S. valuation multiples were at high levels and normalized during the decade. Despite slightly faster earnings growth, the S&P 500 delivered investors a cumulative total return of -9% (-1% annualized) as the reversion in valuation multiples overwhelmed the growth in earnings and contributions from dividends. Meanwhile, international stocks fared much better because international dividends and earnings growth were enough to offset a far more modest valuation multiple decline, and the MSCI ACWI ex-U.S. generated a cumulative total return of +36% (3% annualized).
The Lost Decade: Annualized Total Return Decomposition
(January 2000 – December 2009)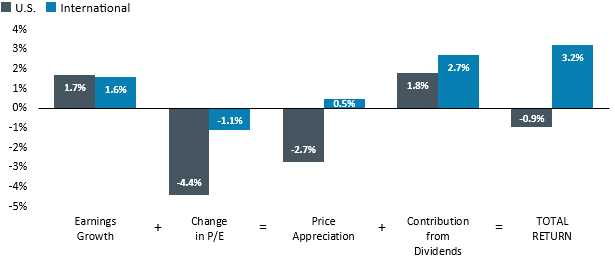
Source: Bloomberg; methodology interpreted from John Bogle’s expected return formula. International data and performance represented by MSCI ACWI ex-U.S. Index, U.S. data and performance represented by S&P 500 Index.
Over the last 15 years, U.S. outperformance can be characterized by superior earnings growth and valuation multiple expansion – in other words, companies grew faster and investors were more willing to pay higher prices for that growth.
Valuation Ranges Across Regions
(12-Month Forward P/E, January 2010 – June 2025)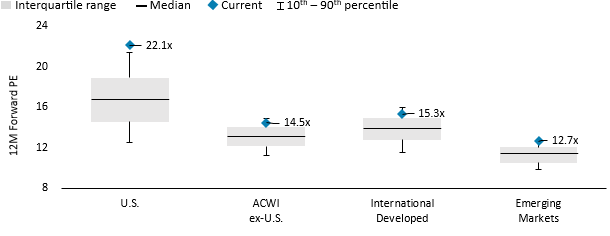
Source: Bloomberg; U.S. is S&P 500 Index, ACWI ex-U.S. is MSCI ACWI ex-U.S. Index, International Developed is MSCI World ex-U.S. Index and Emerging Markets is MSCI Emerging Markets Index.
In contrast, international valuation multiples have contracted over the past 15 years, which resulted in the MSCI ACWI ex-U.S. P/E Ratio at the biggest discount relative to the S&P 500 since 2005—39% at the end of 2024.
International Premium (Discount) to U.S.
MSCI ACWI-ex U.S. Index 12-Month Forward P/E Relative to S&P 500 Index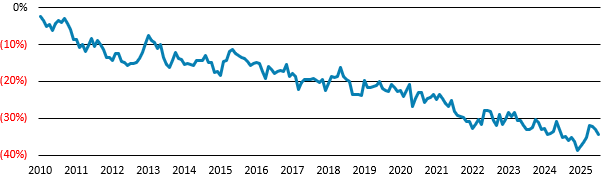
Source: Bloomberg; International data represented by MSCI ACWI ex-U.S. Index, U.S. data represented by S&P 500 Index.
The likelihood of U.S. valuations normalizing in the near future is high.
- U.S. valuation multiples are significantly higher relative to both its historical range and international equities. While this is a key factor, it alone does not guarantee a market shift.
- Tariffs are likely to drive higher U.S. inflation and lower economic growth, pressuring the earnings outlook for U.S. equities.
- Lower U.S. valuation multiples could result from record-high policy uncertainty and loss of confidence in U.S. exceptionalism, which was built on stable policies and governance.
- A weaker U.S. dollar may follow as these same concerns—combined with doubts about the long-term sustainability of U.S. fiscal and debt policies—could reverse the currency tailwind U.S. equities have enjoyed over the past 15 years relative to international equities.
As U.S. equities experienced during their lost decade, multiple reversion from a high starting point is difficult to overcome. Thus, potentially setting the stage for a change in leadership from U.S. to international equities.
Disclosures:
Investors should consider the investment objectives, risks, charges and expense of each fund carefully before investing. This and other information is found in the prospectus and summary prospectus. For a prospectus or summary prospectus, visit bairdfunds.com. Please read the prospectus or summary prospectus carefully before investing.
The Fund may hold fewer securities than other diversified funds, which increases the risk and volatility because each investment has a greater effect on the overall performance. The Fund invests in equity securities of foreign companies. Foreign investments involve additional risks such as currency rate fluctuations and the potential for political and economic instability, and different and sometimes less strict financial reporting standards and regulations.
Information in this document regarding market or economic trends, or the factors influencing historical or future performance, reflects the opinions of management as of the date of this document. These statements should not be relied upon for any other purpose. They are for information purposes only and should not be used or construed as an offer to sell, a solicitation of an offer to buy, or a recommendation to buy, sell or hold any security, investment strategy, or market sector. No forecasts can be guaranteed. Opinions and examples are meant as an illustration of broader themes and are not an indication of trading intent. There is no guarantee that the information supplied is accurate, complete, or timely, nor are there any warranties with regards to the results obtained from its use. Past performance is no guarantee of future results. Investing involves risk, including the possible loss of principal and fluctuation of value.
Earnings Growth is the portion of a company's profit allocated to each share of common stock and serves as an indicator of a company’s profitability. P/E Ratio (Forward 12 month) is a valuation of a company’s current share price compared to its expected per-share earnings. Price Appreciation is the sum of Earnings Growth plus Change in P/E. Contribution from Dividends is calculated by Total Return minus Price Appreciation.
The S&P 500® Index is an unmanaged index consisting of 500 publicly traded large-cap U.S. companies. The MSCI ACWI ex-U.S. Index® is a free float-adjusted market capitalization weighted index designed to represent performance of large- and mid-cap stocks across developed and emerging markets excluding the United States. The MSCI World ex-U.S. Index® is a free float-adjusted, market capitalization-weighted index designed to represent performance of large- and mid-cap stocks across developed markets excluding the United States. The MSCI Emerging Markets Index® is a free float-adjusted, market capitalization-weighted index designed to represent performance of large- and mid-cap stocks across emerging markets. Indices are unmanaged and direct investment is not possible.
The MSCI information may only be used for your internal use, may not be reproduced or disseminated in any form and may not be used as a basis for or a component of any financial instruments or products or indices. None of the MSCI information is intended to constitute investment advice or a recommendation to make (or refrain from making) any kind of investment decision and may not be relied on as such. Historical data and analysis should not be taken as an indication or guarantee of any future performance analysis, forecast or prediction. The MSCI information is provided on an “as is” basis and the user of this information assumes the entire risk of any use made of this information. MSCI, each of its affiliates and each other person involved in or related to compiling, computing or creating any MSCI information (collectively, the “MSCI Parties”) expressly disclaims all warranties (including, without limitation, any warranties or originality, accuracy, completeness, timeliness, non-infringement, merchantability and fitness for a particular purpose) with respect to this information. Without limiting any of the foregoing, in no event shall any MSCI Party have any liability for any direct, indirect, special, incidental, punitive, consequential (including, without limitation, lost profits) or any other damages. (www.msci.com)
Baird Funds are offered through Robert W. Baird & Co. Incorporated, a registered broker/dealer, member NYSE and SIPC. Robert W. Baird & Co. Incorporated also serves as investment advisor for the Fund and receives compensation for these services as disclosed in the current prospectus.
©2025 Robert W. Baird & Co. Incorporated. First use: 08/2025