
How Long Can the Recent International Outperformance Continue?
After more than a decade of U.S. dominance, the tone has shifted, and investors understandably want to know whether this is a brief rebound—or the start of a new leadership cycle. While we do not time markets or make predictions, we believe long-term investors can benefit from maintaining international exposure by understanding the broader structural forces that have historically shaped these cycles.
A Clear Break from the Last Cycle
Following an extended stretch of U.S. outperformance, 2025 marked a meaningful turning point. International equities significantly outpaced U.S. markets:
- MSCI World ex‑U.S.: ~33%
- MSCI ACWI ex‑U.S.: ~33%
- S&P 500: ~18%
This type of relative shift could mark the early stages of a renewed cycle of international market leadership, as history shows leadership tends to move in long arcs shaped by macroeconomic regime shifts—policy, rates, currency, and earnings composition—rather than short-term sentiment. The current phase of international strength may persist, supported by more attractive relative valuations, a softer U.S. dollar, and broadening global earnings growth.
What History Tells Us: Cycles Tend to Run Long
The five-year rolling relative returns between the S&P 500 and MSCI World ex-U.S. highlight multi-year cycles of leadership.
Five-Year Rolling Returns*
(S&P 500 Index – MSCI World ex-U.S. Index)
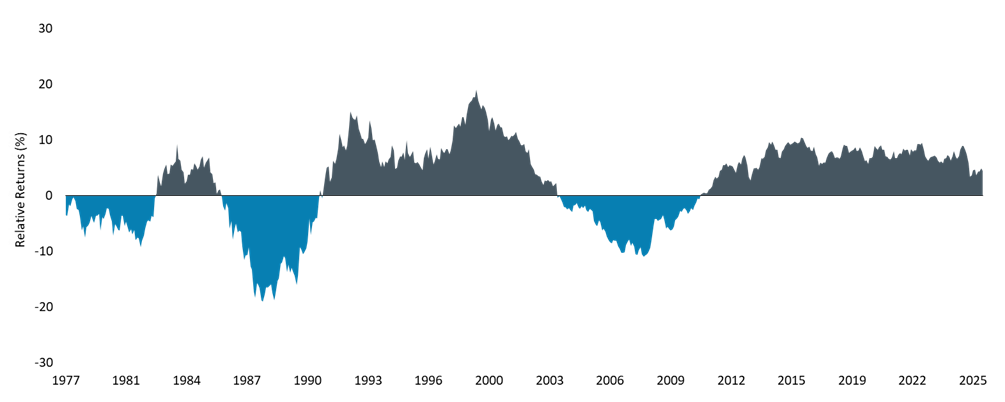
Sources: Bloomberg and eVestment; monthly 5-year rolling returns. U.S. outperformance represented by S&P 500 Index; International outperformance represented by MSCI World ex-U.S. Index. Past performance is not indicative of future performance.
History of Leadership Cycles – What Drove Each Turn
| Period | Leadership | Catalyst | What Changed |
| Late 1970s – early 1980s |
International | U.S. stagflation, weak dollar | Stagflation weighed on U.S. equities; a depreciating dollar amplified international returns. |
| Early-to-mid 1980s |
U.S. | Reagan expansion, Volcker disinflation, dollar surge | High real rates attracted global capital, pushing the dollar up ~50%. Dollar strength hurt international returns. |
| Late 1980s | International | Plaza Accord, Japanese asset bubble | The Plaza Accord drove dollar depreciation. Japan's markets surged; the Nikkei tripled to its December 1989 peak. |
| 1990s | U.S. | Japan bubble collapse, U.S. tech boom | Japan's market collapsed and entered prolonged decline. U.S. tech and productivity gains drove earnings growth. |
| Early-to-mid 2000s |
International | Commodity super-cycle, China's WTO entry, weak dollar | China's industrialization fueled commodity demand. EM and Europe surged on global trade expansion. |
| Late 2000s | Transitional | Global financial crisis | The 2008 crisis ended the commodity cycle. The Fed's policy response laid the groundwork for subsequent U.S. leadership. |
| 2010s – mid 2020s |
U.S. | QE, ultra-low rates, tech platform dominance | U.S. mega-caps captured global digital growth. Strong dollar and expanding multiples drove outperformance. |
| 2025 | International (Potential Inflection Point) |
Softer USD, wide valuation gap, fiscal renewal abroad | Global capex, defense, and infrastructure spending are among the drivers lifting EAFE and EM. Whether this marks a new cycle or a shorter-term rotation remains to be seen. |
Key Observations Across Cycles
- Cycles typically last 5 – 15 years. Once a shift begins, momentum often persists.
- Valuation gaps matter. At turning points, valuation gaps are wide. International markets usually begin their leadership runs at 30–40% discounts to U.S. valuations, levels similar to 2024–25.
- Currency trends have been influential. Nearly every period of international outperformance coincided with a weaker dollar.
- Major macro inflection points. Changes in inflation regimes, interest-rate cycles, and currency trends—have historically marked leadership transitions.
Early Signs Could Indicate a Structural Shift in Market Leadership
Several features of today’s market backdrop resemble the early stages of past international leadership cycles. In broad terms, we see three dynamics at work:
- Valuation support: Despite recent gains, international equities still trade at meaningful discounts to U.S. equities on both forward earnings and cyclically adjusted measures.
- Broader macro tailwinds: A softer dollar, rising investment outside the U.S., and improving productivity trends across Europe, Japan, and emerging Asia have contributed to a more balanced global growth profile.
- Widening earnings drivers: Sector leadership is broadening beyond a handful of large U.S. technology firms, with growth coming from areas such as semiconductors, industrial automation, life sciences, software, digital commerce, and consumer and financial services in emerging markets.
Together, these factors suggest that the recent strength in international markets reflects more than just short-term market rotation.
International Investing: A Prudent Diversification Practice
Maintaining global exposure, rebalancing systematically, and being active in their approach with proven managers can help investors capture the compounding effect of shifts in leadership over time. We continue to see attractive opportunities across cloud computing, software-as-a-service, digital transformation, artificial intelligence, semiconductor technology, e-commerce, payment systems, industrial automation, electric vehicles, and innovative biologic and biosimilar therapies. In addition, the continued expansion of consumer markets—particularly in emerging economies, notably across Asia—offers a growing opportunity set as demand for consumer products and financial services accelerates.
Conclusion: Could this be the start of a new cycle?
Market leadership cycles tend to be long lived and valuation driven. While no cycle repeats exactly, and past performance does not guarantee future results, history suggests the current shift is more than a short-term anomaly. It may signal a broader regime change influenced by currencies, policy, and earnings dynamics that may continue for years.
Disclosures:
Investors should consider the investment objectives, risks, charges and expense of each fund carefully before investing. This and other information is found in the prospectus and summary prospectus. For a prospectus or summary prospectus, visit bairdfunds.com. Please read the prospectus or summary prospectus carefully before investing.
The Fund may hold fewer securities than other diversified funds, which increases the risk and volatility because each investment has a greater effect on the overall performance. The Fund invests in equity securities of foreign companies. Foreign investments involve additional risks such as currency rate fluctuations and the potential for political and economic instability, and different and sometimes less strict financial reporting standards and regulations.
Information in this document regarding market or economic trends, or the factors influencing historical or future performance, reflects the opinions of management as of the date of this document. These statements should not be relied upon for any other purpose. They are for information purposes only and should not be used or construed as an offer to sell, a solicitation of an offer to buy, or a recommendation to buy, sell or hold any security, investment strategy, or market sector. No forecasts can be guaranteed. Opinions and examples are meant as an illustration of broader themes and are not an indication of trading intent. There is no guarantee that the information supplied is accurate, complete, or timely, nor are there any warranties with regards to the results obtained from its use. Past performance is no guarantee of future results. Investing involves risk, including the possible loss of principal and fluctuation of value.
The S&P 500® Index is an unmanaged index consisting of 500 publicly traded large-cap U.S. companies. The MSCI World ex-U.S. Index® is a free float-adjusted, market capitalization-weighted index designed to represent performance of large- and mid-cap stocks across developed markets excluding the United States. The MSCI ACWI ex-U.S. Index® is a free float-adjusted market capitalization weighted index designed to represent performance of large- and mid-cap stocks across developed and emerging markets excluding the United States. Indices are unmanaged and direct investment is not possible.
The MSCI information may only be used for your internal use, may not be reproduced or disseminated in any form and may not be used as a basis for or a component of any financial instruments or products or indices. None of the MSCI information is intended to constitute investment advice or a recommendation to make (or refrain from making) any kind of investment decision and may not be relied on as such. Historical data and analysis should not be taken as an indication or guarantee of any future performance analysis, forecast or prediction. The MSCI information is provided on an “as is” basis and the user of this information assumes the entire risk of any use made of this information. MSCI, each of its affiliates and each other person involved in or related to compiling, computing or creating any MSCI information (collectively, the “MSCI Parties”) expressly disclaims all warranties (including, without limitation, any warranties or originality, accuracy, completeness, timeliness, non-infringement, merchantability and fitness for a particular purpose) with respect to this information. Without limiting any of the foregoing, in no event shall any MSCI Party have any liability for any direct, indirect, special, incidental, punitive, consequential (including, without limitation, lost profits) or any other damages. (www.msci.com)
Baird Funds are offered through Robert W. Baird & Co. Incorporated, a registered broker/dealer, member NYSE and SIPC. Robert W. Baird & Co. Incorporated also serves as investment advisor for the Fund and receives compensation for these services as disclosed in the current prospectus.
©Robert W. Baird & Co. Incorporated. First use: 01/2026