
Infrastructure’s Hidden Trillions
A Structural Opportunity for Municipal Investors
By: Duane A. McAllister, CFA, Managing Director, Co-Lead Municipal Sector / Senior Portfolio Manager and Lyle J. Fitterer, CFA Managing Director, Co-Lead Municipal Sector / Senior Portfolio Manager
Key Takeaways
Infrastructure Gap Drives Municipal Opportunity
The U.S. faces a $1+ trillion municipal infrastructure burden and a $3.7 trillion funding gap over the next decade, shifting financing responsibility to local issuers and creating sustained municipal bond supply growth.
Rising Municipal Issuance Meets Expanding Demand
Record borrowing and renewed issuance momentum point to a structurally larger municipal market, supported by growing demand across mutual funds, ETFs, and long-duration investors seeking high-quality infrastructure exposure.
Compelling Valuation and Yield Curve Advantages
A steep municipal yield curve and improving relative value versus taxable bonds enhance income potential, while expanding credit opportunities reward active management and disciplined credit analysis.
There is an old joke, familiar to anyone who has spent time in the northern half of the U.S.: There are only two seasons, winter and construction. While the joke is less humorous when stuck in traffic or dodging barricades on a daily commute, there is truth in the comment. This was evident at a recent business luncheon in Milwaukee where a panel of civic leaders were asked to identify the greatest challenge the community faces. One individual quipped, potholes! And while the room chuckled, everyone understood the point.
And Milwaukee is by no means unique. Drive across any American city and the infrastructure needs are obvious – crumbling roads, closed bridges, broken water or sewer pipes, aging school buildings and much more.
Although we see the challenges, and federal, state and local authorities talk about addressing the problems, too little historically has been done. The result, which has grown quietly but at enormous scale, is a backlog of deferred repairs and unbuilt projects that now represents one of the most significant financial realities facing U.S. cities and towns.
The Scale of Unmet Needs
Two recent reports are helpful in measuring the magnitude of the unmet infrastructure need. One is rooted in municipal accounting, the other in engineering assessments. Yet, both reach the same sobering verdict: the U.S. faces a staggering infrastructure funding gap, and much of the burden of closing it will fall on state and local governments.
The first report, from Merritt Research Services, introduced the Infrastructure and Capital Asset (ICA) Burden which quantifies the inflation-adjusted replacement cost of city capital assets still in service. Drawing on audited financial statements from nearly 2,000 U.S. cities, Merritt estimates the aggregate ICA Burden at $1.03 trillion. For perspective, this funding need is 2.6X the amount of total direct debt outstanding for the cities and 4.1X their total unfunded pension liability. Yet, this obligation appears nowhere on city balance sheets. Instead, it is an off-balance-sheet commitment that few are contemplating.
Similarly, the 2025 Report Card for America’s Infrastructure from the American Society of Civil Engineers’ (ASCE), confirmed the physical dimension. Although America’s overall infrastructure GPA improved from C− to C between 2021 and 2025, buoyed by the federal $580 billion Infrastructure Investment and Jobs Act (IIJA), half of the assessed categories still grade in the D range. Critical infrastructure including roads, aviation, schools, wastewater and transit each face funding gaps measured in the hundreds of billions, as shown below.
ASCE 10-year investment gap by sector (billions USD, 2024–2033)
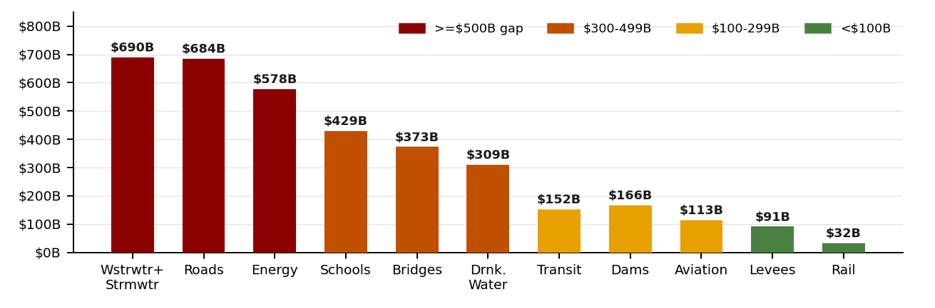
Against a total estimated need of $9.1 trillion over the next decade, even after accounting for projected funding of $5.4 trillion (based on public data and ASCE’s 2024 Bridging the Gap study forecast), a $3.7 trillion funding gap remains. This shortfall shifts the burden toward state and local issues and by extension, the municipal bond market.
Expect Municipal Supply to Grow and Demand to Broaden
We expect the municipal bond market to play a significant role in funding the backlog of infrastructure projects and believe there is room to borrow more.
The total amount of municipal debt outstanding nearly doubled in the ten-year period from 2000 – 2010, from $2 to $4 trillion, but then flat-lined until recently. The post-financial crisis era after 2009-10 ushered in a period of relative frugality for municipalities for nearly 15 years. Yet, borrowing by corporations and the U.S. Treasury continued to grow steadily. Not until the post-covid federal stimulus funds were distributed and federal infrastructure incentive programs were implemented did the municipal market begin to expand again. Over the last two years, record levels of municipal borrowing have occurred, and the accelerated issuance has continued into 2026 as we are once again on a record pace through the mid-point of the year.
At the same time, the demand for municipals has grown to meet the supply. Assets in mutual funds, ETFs and separately managed accounts have all grown in recent years. Institutional demand from banks and insurance companies has been less robust, but this was mostly driven by the tax reform act of 2017 which lowered corporate tax rates. The demand for long-lived, higher-quality infrastructure debt remains substantial and will grow again as valuations improve. The old saying that “supply creates its own demand,” seems to be occurring in real time today in the municipal market.
US Fixed Income Debt Outstanding, $ billions (2000–2025)
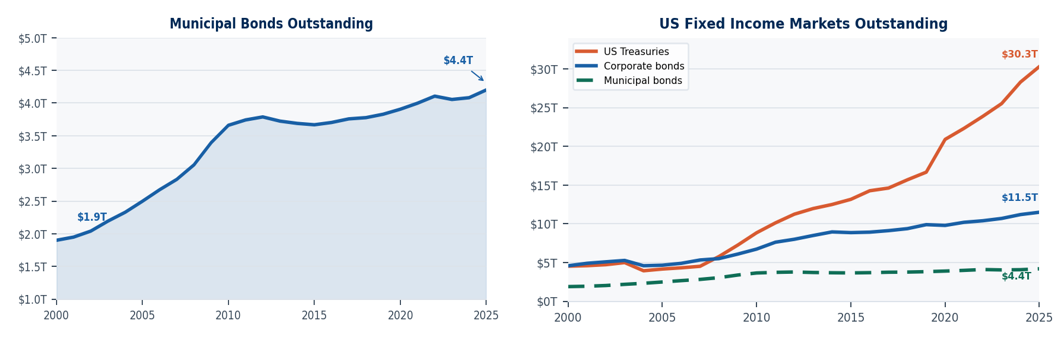
Source: SIFMA Capital Markets Fact Books; SIFMA Fixed Income Market Structure Compendium; Federal Reserve Z.1 Financial Accounts. Municipal bonds = all domestic non-financial issuers. Corporate bonds = total (investment grade ~75–80% of outstanding).
The Funding Challenge
Will municipalities be able to afford a higher debt burden? Generally speaking, the answer is yes, although it will obviously vary for each municipality.
According to data from the National Association of State Budget Officers (NASBO), in fiscal 2025 debt service represented just 2.6% of total state spending. At the local level, it varies, but city-level debt ratios as a percentage of total government expenditures typically vary from 5% – 20%. Cities spending above 15% on debt service imply a rising level of stress. The City of Chicago’s debt service ratio is approximately 17% while the federal government debt burden is currently 14% of federal spending, for reference.
Property taxes, which have historically been the primary source of local revenue and will continue to play a vital role growing forward, are bumping up against both practical and political limits in some areas. In Florida, for example, Gov. DeSantis is seeking to lower the property tax burden on average Floridians by increasing the exemption level for owner-occupied homestead properties. New York City is taking a different approach, seeking to generate additional revenue by increasing property tax rates only on luxury second homes, leaving average New Yorkers unaffected.
We would expect to see municipalities, therefore, increasingly turn to alternative revenue sources to support their borrowing. Among them would be more sales-tax-backed bonds, special assessment districts, tax increment financing, utility revenue bonds and other dedicated infrastructure levies to meet the growing borrowing burden. We would also expect to see layered financing structures, blending federal grants, state revolving fund loans and local bonds. Finally, infrastructure’s long-lived, cash-generating nature makes it a natural fit for additional private capital. Using public-private partnership (P3) structures mobilize private investment without immediate tax increases or bond issuance, with private partners bearing construction and operational risk.
Opportunities Ahead
A steadily increasing supply of municipal debt has several favorable implications for investors, including:
- Enhanced relative value: A larger municipal market should enhance the relative value of municipal bonds (particularly tax-exempt securities) relative to taxable bonds. If the gap in total debt outstanding narrows even modestly, between municipals and taxable markets, we expect there will be increasingly attractive entry points to add exposure to the municipal sector.
- Capitalizing on the steep municipal yield curve: The municipal yield curve is already much steeper than the U.S. Treasury curve. Between 2- and 30-year maturities, municipals offer nearly twice the slope of Treasuries, which enhances the roll-down benefit for investors. Most municipal debt is issued longer on the curve to match the longer average life of the assets being funded. This should help maintain a steep, upwardly sloped curve for investors able/willing to extend maturities.
- Provide more credit opportunities: A larger municipal market should create a broader opportunity set for active managers to analyze and invest in new credits. Having the analytical framework to evaluate diverse pledges and layered financing structures offers the ability to capture yield without taking undue credit risk.
- Benefit our cross-sector research capabilities: The growth of P3 requires an understanding of where an asset sits in the capital structure and project finance covenants to evaluate the full credit profile of infrastructure-related bonds. Our integrated municipal, corporate and structured product sector teams reinforce the value of the Baird Advisors active management approach.
While the timing and pace of infrastructure spending will vary, the direction is clear. A growing need for capital, combined with evolving financing structures, suggests a larger and more complex municipal market in the years ahead. In our view, that is not a challenge to navigate, but an opportunity to be understood and actively managed.
Past performance does not guarantee future results.
Investors should consider the investment objectives, risks, charges and expenses of each fund carefully before investing. This and other information is found in the prospectus and summary prospectus. For a prospectus or summary prospectus, contact Baird directly at 866-442-2473. Please read the prospectus or summary prospectus carefully before investing.
In a rising interest rate environment, the value of fixed income securities generally declines and conversely, in a falling interest rate environment, the value of fixed income securities generally increases. High-yield securities may be subject to heightened market, interest rate or credit risk and should not be purchased solely because of the stated yield. Ratings are measured on a scale that ranges from AAA or Aaa (highest) to D or C (lowest). Investment-grade investments are those rated from highest down to BBB- or Baa3.