
May 2026 Municipal Market Comments
Tax-Exempt Yields Rise Amid Strong Demand
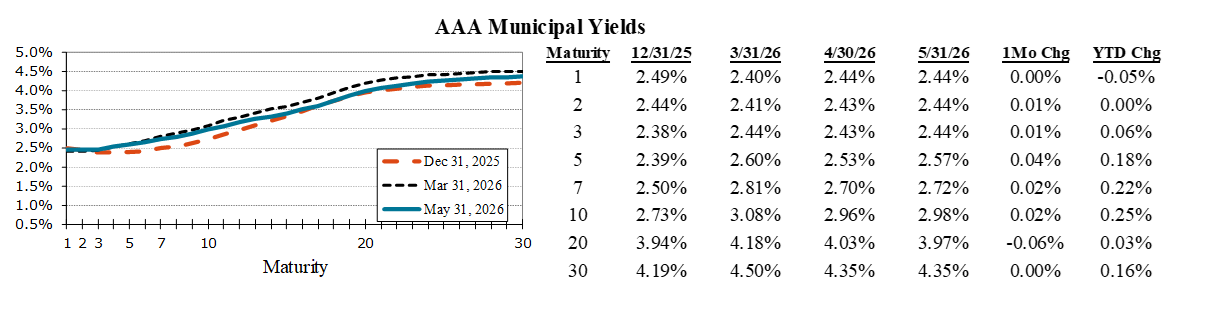
Municipal yields moved modestly higher across much of the curve in May, with the exception of the very front and long ends. Intermediate maturities underperformed, as 5yr yields rose 4 bps and 10yr yields increased 2 bps. Despite these movements, the overall slope of the municipal curve remained largely stable, with the 2s30s curve ending the month at +191 basis points—just 1 basis point flatter than April. This steadiness is notable given the greater volatility observed in Treasuries, with municipals continuing to outperform with lower volatility. The steep municipal curve continues to support carry and roll-down strategies, particularly in longer maturities. Market performance was underpinned by strong technicals. Demand remained robust, supported by approximately $10.3B of net fund inflows during the month, bringing YTD inflows to $39.8B—one of the strongest starts to a year on record. At the same time, May new-issue tax-exempt supply totaled approximately $48B, setting a record for the month and contributing to YTD issuance of roughly $217B, up about 8% from last year’s pace. Looking ahead, seasonal technicals are expected to remain supportive. June, July, and August will see significantly higher reinvestment demand from principal and coupon payments, providing a favorable backdrop for the asset class.
FEMA Reforms
Proposed changes to FEMA policy under a revised framework released by the Trump Administration represent a meaningful shift in the credit backdrop for municipal issuers. Historically, federal disaster aid has served as a key stabilizing force, providing reimbursement for physical damage and supporting recovery efforts. However, recent reform proposals suggest a transition toward a more state- and locally-driven model, where federal support becomes more limited and less certain. Under the framework, disaster response responsibilities would shift more heavily to states and local governments, with stricter thresholds for federal assistance and a move away from the traditional reimbursement-based approach. Rather than covering a defined share of actual recovery costs, federal aid would become less tied to realized damages, introducing greater uncertainty around total support. As a result, issuers could face a higher burden to manage recovery costs, particularly if federal support falls short of losses. For the municipal market, this evolving landscape may introduce greater credit differentiation, with smaller or less well-resourced issuers in disaster-prone regions facing increased pressure on reserves and leverage following events. That said, many state and local governments enter this transition from a position of relative strength. Elevated reserve levels, solid liquidity, and improved financial management provide an important buffer, while also allowing issuers to adapt by strengthening reserves, enhancing insurance coverage, and investing in mitigation and resilience measures ahead of future events.
Positive May Returns
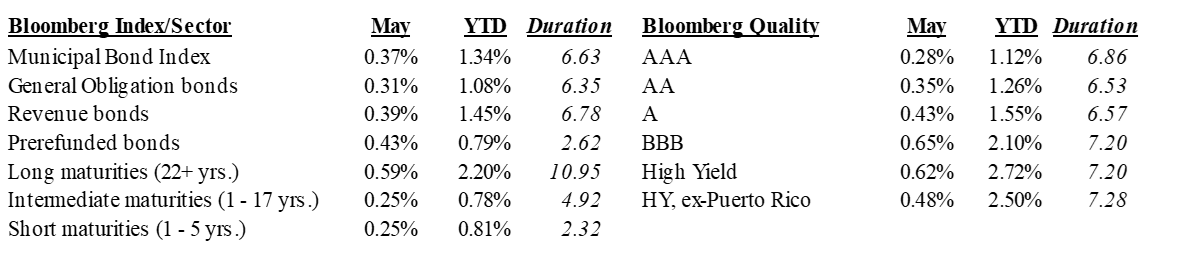
May returns were positive despite a modest increase in yields. Long-duration bonds led performance, as rates were largely stable in the month. Prerefunded issues, with their shorter duration profiles, outperformed both GOs and Revenue bonds. Lower-rated bonds also led returns, with securities rated BBB leading higher-quality counterparts. High Yield continued to outperform IG on the year.
Total Returns of Selected Barclays Municipal Indices and Subsectors
Disclosures
Fixed income is generally considered to be a more conservative investment than stocks, but bonds and other fixed income investments still carry a variety of risks such as interest rate risk, credit risk, inflation risk, and liquidity risk. In a rising interest rate environment, the value of fixed-income securities generally decline and conversely, in a falling interest rate environment, the value of fixed-income securities generally increase. High yield securities may be subject to heightened market, interest rate or credit risk and should not be purchased solely because of the stated yield.
The Bloomberg Municipal Bond Index is a broad-based, total-return index. The bonds are all investment-grade, tax-exempt, and fixed-rate securities with long-term maturities (greater than 2 years). They are selected from issues larger than $50 million. The components listed below the Municipal Bond Index (long maturities, intermediate maturities, short maturities, prefunded bonds, general obligation bonds and revenue bonds) are subsectors of the Bloomberg Municipal Bond Index and do not represent separate indices.
The Bloomberg High Yield Municipal Index includes bonds with a par value of at least $3 million and must be issued as part of a transaction of at least $20 million. The maximum rating for inclusion is Ba1/BB+/BB+ using the middle rating.
For more information about the Bloomberg Municipal Bond Index or Bloomberg High Yield Municipal Index, please visit https://www.bloomberg.com/professional/products/indices/documentation/?currentPage=1
Municipal securities investments are not appropriate for all investors, especially those taxed at lower rates. The alternative minimum tax (AMT) may be applicable, even for securities identified as tax exempt. Past performance is not a guarantee of future results.
Ratings are measured on a scale that ranges from AAA or Aaa (highest) to D or C (lowest). Investment grade investments are those rated from highest down to BBB- or Baa3.
Robert W. Baird & Co. Incorporated.
This is not a complete analysis of every material fact regarding any com