
July 2026 Municipal Market Comments
Tax-Exempt Yields Rise Even As Supply Moderates
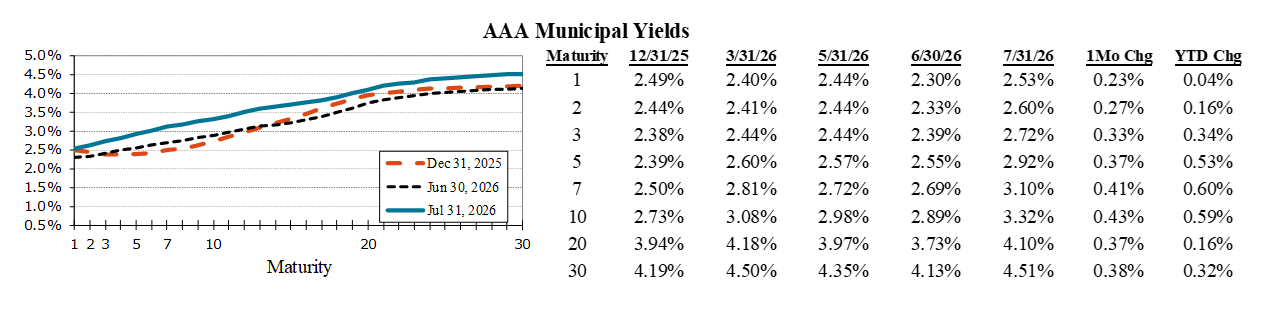
Tax-exempt yields moved higher in July, led by intermediate maturities, as municipal bonds followed the weakening trend in the Treasury market and investor expectations over Federal Reserve policy shifted. The 10yr AAA municipal yield rose 43 bps during the month, while the 2yr and 30yr yields increased 27 bps and 38 bps, respectively. The selloff resulted in a modest steepening of the municipal yield curve, with the spread between 2yr (2.60%) and 10yr (3.32%) yields widening to 72 bps from 56 bps at the end of June. Municipal yields rose more in July than those of comparable-maturity Treasuries, enhancing the cross-market relative value of the sector. For example, the 2yr and 5yr Municipal/Treasury yield ratios each rose from 60% to 65% during the month. Higher municipal yields helped keep investor demand resilient, as municipal bond funds attracted approximately $9.1B of net inflows during July, bringing YTD inflows to roughly $59B, among the strongest starts to a year in decades. Although new-issue supply of $45B in July fell 15% from the same month last year, the YTD total of $321B is still about 4% ahead of last year’s record pace. The favorable seasonal conditions for municipals continue through August, providing ample demand for another month of expected robust issuance. However, the trend typically eases in the fall, as the September roll-off from maturities and early calls is expected to be roughly one-half the amount that will occur in August.
Municipal Fundamentals Are Past Peak but Remain Strong
Municipal credit fundamentals remain strong, supported by healthy reserves and generally conservative budgeting practices across most state and local governments. Yet, as expected, signs are emerging that the exceptionally favorable post-pandemic credit environment is beginning to normalize. In July, Moody’s revised its outlook on U.S. cities and counties to Negative from Stable, noting that many municipalities have now moved past peak conditions. Revenue growth has moderated from the unusually strong pace experienced in recent years, while inflationary pressures continue to drive higher labor, healthcare, and capital costs for many issuers. These dynamics suggest to Moody’s that rising expenditures and slowing revenue growth will create a more challenging operating environment in the years ahead. The one-time pandemic aid strengthened reserves and supported operations across the municipal landscape, but those resources have largely been exhausted. As a result, credit performance is becoming more dependent on issuer-specific factors such as financial flexibility, economic diversity, demographics, and management decisions rather than the broad tailwinds that supported nearly all issuers in recent years. These trends highlight how the municipal landscape continues to evolve as issuers adjust to a more typical operating environment. Even so, broad municipal fundamentals remain supported by healthy reserves, conservative financial management, and historically low default activity.
Negative Returns in July
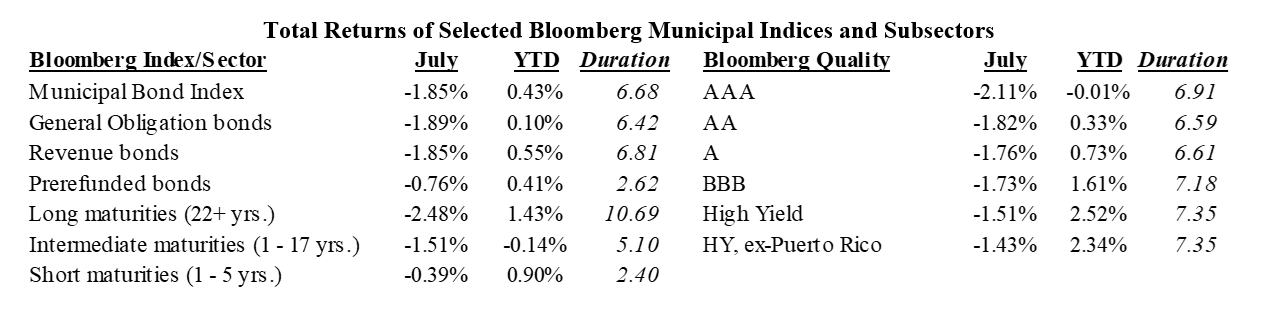
Returns were negative for the month, as rates rose across the curve. Short maturities outperformed longer maturities. Prerefunded issues outperformed both GO and Revenue sectors due to their shorter average duration. Lower-rated bonds also led returns, with securities rated BBB outperforming higher-quality issues and High Yield outperforming Investment Grade.
Disclosures
Information in this document regarding market or economic trends, or the factors influencing historical or future performance, reflects the opinions of management as of the date of this document. These statements should not be relied upon for any other purpose. This is not a complete analysis of every material fact regarding any company, industry, or security. The information has been obtained from sources we consider to be reliable, but we cannot guarantee the accuracy. Past performance is no guarantee of future results. Indices are unmanaged and are not available for direct investment.
Fixed income is generally considered to be a more conservative investment than stocks, but bonds and other fixed income investments still carry a variety of risks such as interest rate risk, credit risk, inflation risk, and liquidity risk. In a rising interest rate environment, the value of fixed-income securities generally decline and conversely, in a falling interest rate environment, the value of fixed-income securities generally increase. High yield securities may be subject to heightened market, interest rate or credit risk and should not be purchased solely because of the stated yield.
The Bloomberg Municipal Bond Index is a broad-based, total-return index. The bonds are all investment-grade, tax-exempt, and fixed-rate securities with long-term maturities (greater than 2 years). They are selected from issues larger than $50 million. The components listed below the Municipal Bond Index (long maturities, intermediate maturities, short maturities, prefunded bonds, general obligation bonds and revenue bonds) are subsectors of the Bloomberg Municipal Bond Index and do not represent separate indices.
The Bloomberg High Yield Municipal Index includes bonds with a par value of at least $3 million and must be issued as part of a transaction of at least $20 million. The maximum rating for inclusion is Ba1/BB+/BB+ using the middle rating.
For more information about the Bloomberg Municipal Bond Index or Bloomberg High Yield Municipal Index, please visit https://www.bloomberg.com/professional/products/indices/documentation/?currentPage=1
Municipal securities investments are not appropriate for all investors, especially those taxed at lower rates. The alternative minimum tax (AMT) may be applicable, even for securities identified as tax exempt. Past performance is not a guarantee of future results.
Ratings are measured on a scale that ranges from AAA or Aaa (highest) to D or C (lowest). Investment grade investments are those rated from highest down to BBB- or Baa3.
©2026 Robert W. Baird & Co. Incorporated.