
August 2026 Municipal Market Comments
Tax-Exempt Curve Steepens as Demand Persists
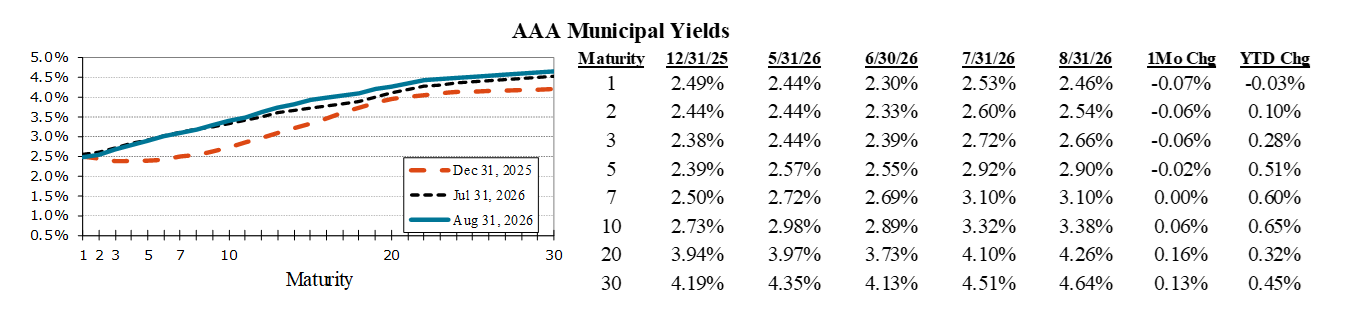
Tax-exempt yields were mixed in August as short-term rates declined while longer maturities moved higher. The 2yr AAA municipal yield fell 6 bps during the month, while the 10yr yield rose 6 bps and the 30yr yield increased 13 bps, resulting in a steeper yield curve. The spread between 2yr (2.54%) and 30yr (4.64%) AAA municipal yields widened to 210 bps, approaching its YTD high of 216 bps reached in March. The municipal curve now stands substantially steeper than its Treasury counterpart, with the Treasury 2s30s spread ending August at 90 bps. The steeper curve combined with higher long-term yields has enhanced roll-down opportunities for investors extending out the curve, with the most attractive roll-return opportunities currently concentrated in the 20yr to 23yr range. Higher yields and a steeper municipal curve helped sustain strong investor demand despite a record issuance calendar. Municipal bond funds recorded approximately $8B of net inflows during August, bringing YTD inflows to roughly $67B, the second-strongest pace on record behind 2021. Meanwhile, August tax-exempt issuance reached a record $58B, up 26% from a year ago, lifting YTD issuance to $380B, 7% ahead of last year’s record pace. With elevated net supply expected through the fall, strong investor demand will be necessary to absorb the record issuance with little disruption.
Plenty of Capacity in Municipal Market to Finance Infrastructure and Resilience Needs
Several factors are increasing the level of borrowing in the municipal market. In addition to rising costs, pent-up infrastructure needs, and support for the AI data center buildout, municipalities are increasingly funding long-term resilience initiatives in response to evolving climate challenges. Examples include the numerous projects related to the record-low water levels along the Colorado River basin, where two decades of drought have left Lake Mead and Lake Powell at historically low levels. Often with federal support, local and regional water and power utilities have issued billions in debt for reservoir projects, pumping stations and additional intake valves, water recycling facilities, and other projects to ensure reliable future water supplies for the region. Countless other infrastructure resilience efforts are also occurring across the country. Beyond this, municipalities are anticipating rising borrowing needs due to FEMA reforms and other federal policy initiatives under which state and local governments will fund a larger share of resilience, recovery, and infrastructure needs in the future. Fortunately, the municipal market appears well positioned to meet these financing demands. Municipal Market Advisors recently noted that aggregate municipal debt has declined to roughly 13% of U.S. economic output in 2026 from 20% in 2013, a substantial reduction in debt burden relative to the growth in the economy. Particularly in contrast to the rapid growth in the debt trajectory at the federal level, state and local governments, due to balanced-budget requirements, have been more frugal, maintaining meaningful borrowing capacity for future needs.
Negative Returns in August
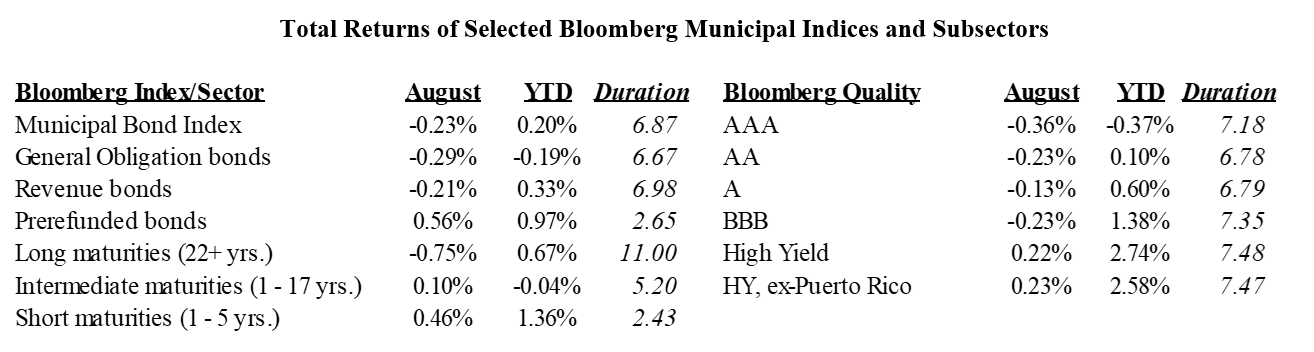
Returns were generally negative in August, with short- and intermediate-maturity bonds outperforming longer maturities as rates moved higher at the long end of the curve. The stronger performance of shorter maturities also benefited Prerefunded issues, the only sector with positive returns for the month. By quality, issues rated A led performance among Investment Grade issues, while High Yield outperformed all credit categories for the month.
Disclosures
Information in this document regarding market or economic trends, or the factors influencing historical or future performance, reflects the opinions of management as of the date of this document. These statements should not be relied upon for any other purpose. This is not a complete analysis of every material fact regarding any company, industry, or security. The information has been obtained from sources we consider to be reliable, but we cannot guarantee the accuracy. Past performance is no guarantee of future results. Indices are unmanaged and are not available for direct investment.
Fixed income is generally considered to be a more conservative investment than stocks, but bonds and other fixed income investments still carry a variety of risks such as interest rate risk, credit risk, inflation risk, and liquidity risk. In a rising interest rate environment, the value of fixed-income securities generally decline and conversely, in a falling interest rate environment, the value of fixed-income securities generally increase. High yield securities may be subject to heightened market, interest rate or credit risk and should not be purchased solely because of the stated yield.
The Bloomberg Municipal Bond Index is a broad-based, total-return index. The bonds are all investment-grade, tax-exempt, and fixed-rate securities with long-term maturities (greater than 2 years). They are selected from issues larger than $50 million. The components listed below the Municipal Bond Index (long maturities, intermediate maturities, short maturities, prefunded bonds, general obligation bonds and revenue bonds) are subsectors of the Bloomberg Municipal Bond Index and do not represent separate indices.
The Bloomberg High Yield Municipal Index includes bonds with a par value of at least $3 million and must be issued as part of a transaction of at least $20 million. The maximum rating for inclusion is Ba1/BB+/BB+ using the middle rating.
For more information about the Bloomberg Municipal Bond Index or Bloomberg High Yield Municipal Index, please visit https://www.bloomberg.com/professional/products/indices/documentation/?currentPage=1
Municipal securities investments are not appropriate for all investors, especially those taxed at lower rates. The alternative minimum tax (AMT) may be applicable, even for securities identified as tax exempt. Past performance is not a guarantee of future results.
Ratings are measured on a scale that ranges from AAA or Aaa (highest) to D or C (lowest). Investment grade investments are those rated from highest down to BBB- or Baa3.
©2026 Robert W. Baird & Co. Incorporated.