
September 2026 Bond Market Comments
Yields Rise Sharply in September as Fed Hikes Amid Strong Economic Data and Stubborn Inflation
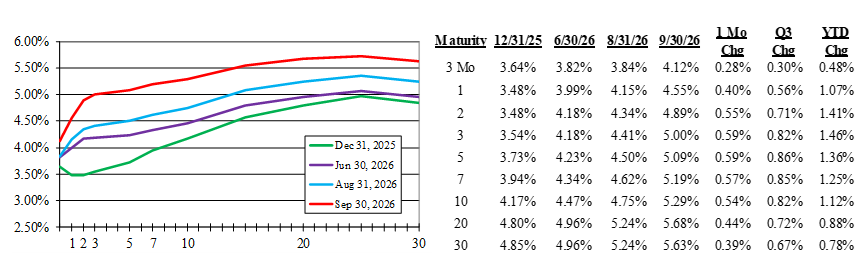
Treasury yields rose notably in Q3, particularly during the month of September. The 10yr yield rose 82 bps in Q3 with 54 bps of that occurring in September. The 10yr yield ended the month at 5.29%, its highest reading since 2002. Yields have risen steadily since the onset of the Iran conflict and in sympathy with Brent oil prices that again exceeded $100/bbl in September. The elevated cost of fuel as well as tariff-induced supply chain challenges have permeated the economy as evidenced by Core PCE inflation of 3% YoY, down from the prior reading of 3.3%, but higher than at the onset of the Iran conflict and above the 2% Fed target. A resilient, strong economy has also contributed to the rise in yields. August nonfarm payrolls of +162k handily exceeded the +55k estimate, manufacturing PMIs were their strongest since 2022, and the unemployment rate of 4.1% remains low, signaling the U.S. is at full employment. As expected, the Fed hiked its policy rate 25 bps to 3.75%–4.00% in a unanimous decision, noting this first hike since 2023 will “support a timelier return to the committee’s 2% [inflation] goal.” The Fed’s own Summary of Economic Projections (SEP) also raised 2026 and 2027 GDP projections alongside its hawkish messaging. The U.S. Treasury, for its part, upped its buyback announcement of long securities to $6B, but fell short at ~$4.1B accepted, and pledged to use its Treasury General Account (TGA) if needed to stem the rise in yields. Nevertheless, Treasury yields rose while new-issue auctions were weaker than normal and priced with larger-than-average concessions, a reflection of buyer hesitancy and competition for capital despite higher yields.
Treasury Yields
Corporate Spreads Stable, Agy RMBS and HY Wider
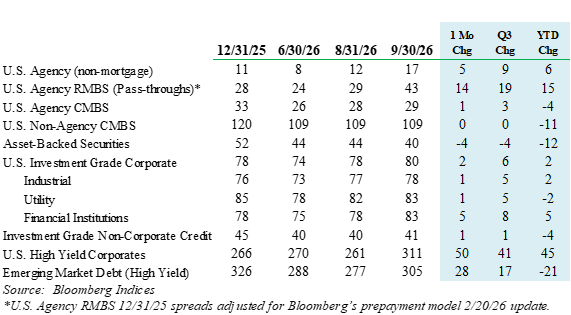
IG Corporate spreads finished at +80 bps, 2 bps wider in September and 6 bps wider in Q3. Corporates exhibited stability compared to Agy RMBS spreads, which were 14 bps wider in September alone. The sector underperformed into the elevated interest rate volatility and moved higher in rates. HY Corporates also underperformed as spreads widened 50 bps in September and 41 bps for Q3.
Option-Adjusted Spreads (in bps)
Weakest Agg Index Quarterly Return Since 2022
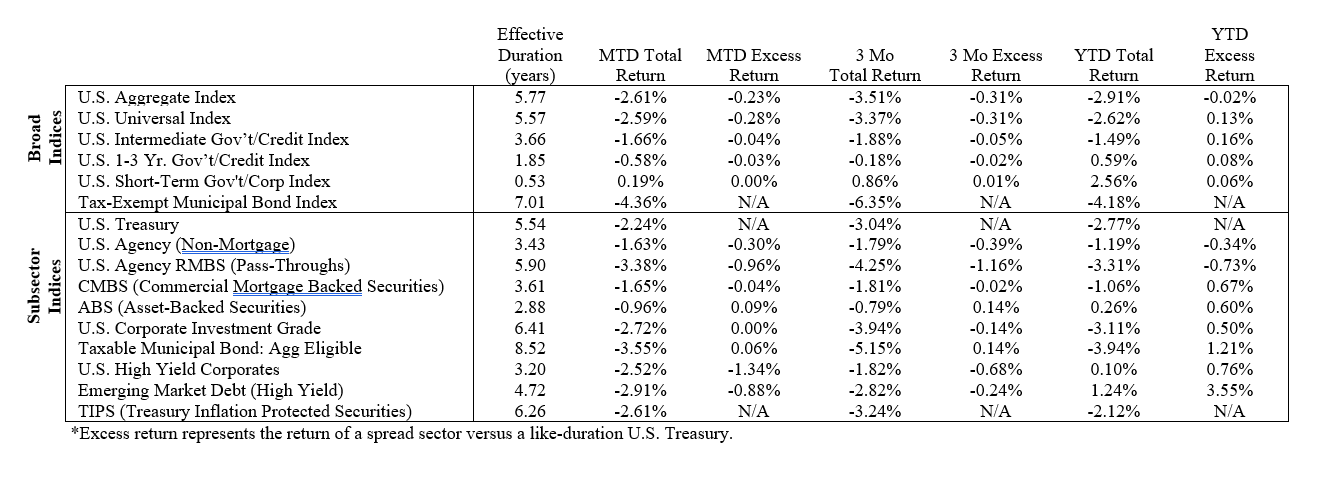
The Agg Index declined 2.61% in September and 3.51% in Q3, its seventh-weakest calendar quarter of all time. Excess returns were mixed in Q3, with Agy RMBS the weakest at -1.16% and taxable municipals the strongest at +0.14%. IG Corporate excess returns were flat in September and modestly negative in Q3 (-0.14%) as spreads widened modestly. Tax-exempt municipals notably underperformed for the month and quarter.
Returns of Selected Bloomberg Indices and Subsectors
Disclosures
Information in this document regarding market or economic trends, or the factors influencing historical or future performance, reflects the opinions of management as of the date of this document. These statements should not be relied upon for any other purpose. This is not a complete analysis of every material fact regarding any company, industry or security. The information has been obtained from sources we consider to be reliable, but we cannot guarantee the accuracy. Past performance is not a guarantee of future results.
Fixed income is generally considered to be a more conservative investment than stocks, but bonds and other fixed income investments still carry a variety of risks such as interest rate risk, credit risk, inflation risk, and liquidity risk. In a rising interest rate environment, the value of fixed- income securities generally decline and conversely, in a falling interest rate environment, the value of fixed-income securities generally increase. High yield securities may be subject to heightened market, interest rate or credit risk and should not be purchased solely because of the stated yield.
Treasury yields are the interest rates that the U.S. government pays to borrow money for varying periods of time.
Option-adjusted spread is the difference between the yield of a security that pays fixed interest payments and the current U.S. Treasury rates, which represents the rate of return on a risk-free investment.
The Bloomberg U.S. Aggregate Bond Index is an index comprised of approximately 6000 publicly traded bonds including U.S. Government, mortgage-backed, corporate, and Yankee bonds with an average maturity of approximately 10 years.
The Bloomberg Government/Credit Index is a combination of the Government Index which measures government-bond general and Treasury funds, and the Credit Bond Index, which is a market value-weighted index which tracks the returns of all publicly issued, fixed-rate, nonconvertible, dollar-denominated, SEC registered, investment grade Corporate Debt.
The Bloomberg Intermediate U.S. Government/Credit Bond Index is a combination of the Government Index which measures government-bond general and Treasury funds, and the Credit Bond Index, which is a market value-weighted index which tracks the returns of all publicly issued, fixed-rate, nonconvertible, dollar-denominated, SEC registered, investment grade Corporate Debt with maturities between one and ten years.
The Bloomberg 1-3 Year U.S. Government/Credit Bond Index is a combination of the Government Index which measures government-bond general and Treasury funds, and the Credit Bond Index, which is a market value-weighted index which tracks the returns of all publicly issued, fixed-rate, nonconvertible, dollar-denominated, SEC registered, investment grade Corporate Debt with maturities between zero and three years.
The Bloomberg U.S. Treasury Index includes public obligations of the U.S. Treasury. Treasury bills are excluded by the maturity constraint of at least one year but are part of a separate Short Treasury Index. In addition, certain special issues, such as state and local government series bonds (SLGs), as well as U.S. Treasury TIPS, are excluded. STRIPS are excluded from the index because their inclusion would result in double- counting. Securities in the Index roll up to the U.S. Aggregate, U.S. Universal, and Global Aggregate Indices. The U.S. Treasury Index was launched on January 1, 1973.
U.S. Agency: This index is the U.S. Agency component of the U.S. Government/Credit index. Publicly issued debt of U.S. Government agencies, quasi-federal corporations, and corporate or foreign debt guaranteed by the U.S. Government (such as USAID securities). The largest issues are Fannie Mae, Freddie Mac, and the Federal Home Loan Bank System (FHLB). The index includes both callable and non-callable agency securities.
U.S Corporate – Investment Grade: This index is the Corporate component of the U.S. Credit index. It includes publicly issued U.S. corporate and specified foreign debentures and secured notes that meet the specified maturity, liquidity, and quality requirements. To qualify, bonds must be SEC-registered.
CMBS (Commercial Mortgage-Backed Securities): This index is the CMBS component of the U.S. Aggregate index. The Bloomberg CMBS ERISA-Eligible Index is the ERISA-eligible component of the Bloomberg CMBS Index. This index, which includes investment grade securities that are ERISA eligible under the underwriter’s exemption, is the only CMBS sector that is included in the U.S. Aggregate Index.
MBS (Mortgage-Backed Securities): This index is the U.S. MBS component of the U.S. Aggregate index. The MBS Index covers the mortgage- backed pass-through securities of Ginnie Mae (GNMA), Fannie Mae (FNMA), and Freddie Mac (FHLMC). The MBS Index is formed by grouping the universe of over 600,000 individual fixed rate MBS pools into approximately 3,500 generic aggregates.
ABS (Asset-Backed Securities): This index is the ABS component of the U.S. Aggregate index. The ABS index has three subsectors: credit and charge cards, autos, and utility. The index includes pass-through, bullet, and controlled amortization structures. The ABS Index includes only the senior class of each ABS issue and the ERISA-eligible B and C tranche. The Manufactured Housing sector was removed as of January 1, 2008, and the Home Equity Loan sector was removed as of October 1, 2009.
Corporate High Yield: The Bloomberg U.S. High Yield Index covers the universe of fixed rate, non-investment grade debt. Eurobonds and debt issues from countries designated as emerging markets (sovereign rating of Baa1/BBB+/BBB+ and below using the middle of Moody’s, S&P, and Fitch) are excluded, but Canadian and global bonds (SEC registered) of issuers in non-EMG countries are included. Original issue zeroes, step-up coupon structures, 144-As and pay-in-kind bonds (PIKs, as of October 1, 2009) are also included.
Emerging Market: Bloomberg uses a fixed list of countries defined as emerging markets countries for index inclusion purposes that is based on World Bank Income group definitions (Low/Middle), IMF country classifications (Non-Advanced Economies), and other advanced economies that may be less accessible or investable for global debt investors.
The Bloomberg Municipal Bond Index is a broad-based, total-return index. The bonds are all investment-grade, tax-exempt, and fixed-rate securities with long-term maturities (greater than 2 years). They are selected from issues larger than $50 million.
The Bloomberg TIPS Index consists of Treasury Inflation Protected Securities (TIPS). TIPS are securities whose principal is tied to the Consumer Price Index. TIPS pay interest semi-annually, based on the fixed rate applied to the adjusted principal.
Ratings are measured on a scale that ranges from AAA or Aaa (highest) to D or C (lowest). Investment grade investments are those rated from highest down to BBB- or Baa3.
This is not a complete analysis of every material fact regarding any company, industry or security. The information has been obtained from sources we consider to be reliable, but we cannot guarantee the accuracy. Indices are unmanaged and are not available for direct investment.
©2026 Robert W. Baird & Co. Incorporated.